ATMS SFR Performance in Recent Snowfall Event
February 26, 2021 07:13 AM
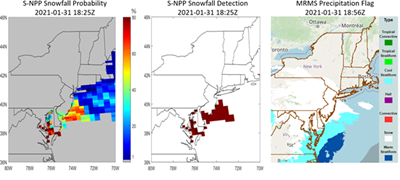
Figure 1: S-NPP over ocean snowfall probability (SP, %) on January 31, 2021 18:25Z (left), S-NPP snowfall detection product derived from SP (middle) where red indicates detected snowfall, and corresponding MRMS precipitation product.
© NOAA/NESDIS
A prolonged snowfall event occurred along the East Coast from January 31 to February 2 of 2021. A case study was conducted to examine the performance of the operational Advanced Technology Microwave Sounder (ATMS) snowfall rate (SFR) product. The study provided an analysis of S-NPP ATMS and NOAA-20 ATMS data. Results generated also included Snowfall Probability (SP, %) and the Snowfall Detection (SD) product derived from SP and were compared with corresponding Multi-Radar Multi-Sensor (MRMS) instantaneous precipitation product. Figure 1, which is referenced again below, shows an example of S-NPP ATMS SFR results with corresponding MRMS precipitation product.
For this study, SFR data from 13 swaths was collected and collocated with Stage IV radar and gauge combined hourly precipitation data. The table below shows the performance statistics of the two satellites.
|
|
Correlation Coefficient
|
Bias (mm/hr)
|
RMS (mm/hr)
|
|
S-NPP
|
0.49
|
-0.02
|
0.70
|
|
NOAA-20
|
0.40
|
0.01
|
0.71
|
They have comparable bias and RMS but S-NPP has higher correlation with Stage IV than NOAA-20. Figure 2 displays the density scatter plots of S-NPP and NOAA-20 SFR vs. Stage IV, respectively.
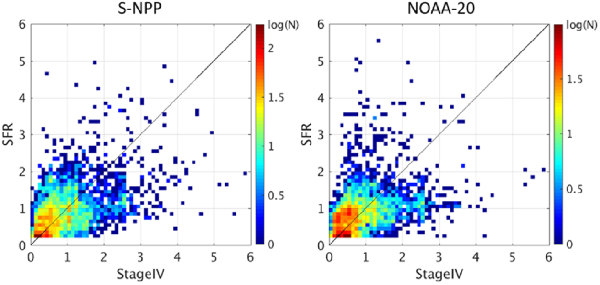
Figure 2: ATMS SFR vs. Stage IV density scatter plots for S-NPP (left) and NOAA-20 (right) from the snowfall event on January 31, 2021 to February 2, 2021.
SFR images were compared to the corresponding MRMS instantaneous precipitation products. Figure 3 below compares (a) the NOAA-20 SFR image on February 1, 2021 17:16Z with the corresponding Multi-Radar Multi-Sensor (MRMS) instantaneous precipitation product and (b) the S-NPP SFR retrievals with the corresponding MRMS image.
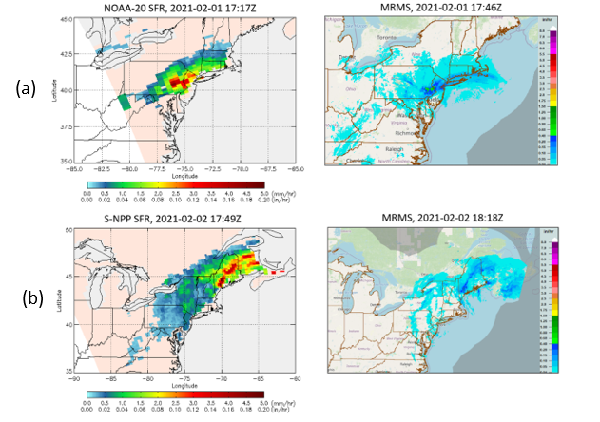
Figure 3: Comparisons of (a) snowfall rate estimates by NOAA-20 SFR on Feb 1, 2021 17:17Z (left) and the corresponding MRMS (right) and (b) estimates by S-NPP SFR on Feb 2, 2021 17:49Z (left) and the corresponding MRMS (right).
For both satellites, the patterns of the intense snowfall align well between the SFR images and the MRMS estimates. The SFR product displays a tendency to underestimate heavier snowfall, as shown in this case. The SFR team is actively studying this issue.
A set of experimental ATMS over ocean (ice-free ocean, coast, and sea-ice) snowfall detection (SD) algorithms has also been developed recently. A preliminary study shows that the algorithms perform well for this snowfall event. Figure 1 (above) shows S-NPP over ocean snowfall probability and SD images on January 31, 2021 18:25Z with the corresponding MRMS precipitation flag product. The S-NPP SD correctly identifies the snowfall off the coasts of New Jersey and Delaware and even in the Chesapeake Bay and along the Potomac River.
CISESS Scientists involved in the ongoing work on the SFR product include H. Meng, J. Dong, Y. You, Y. Fan, C. Kongoli, and R. Ferraro.
« Back