Combined Use of Satellite Observations and the RIM for Assessing Recovery from Natural Disasters
April 22, 2025 10:43 AM
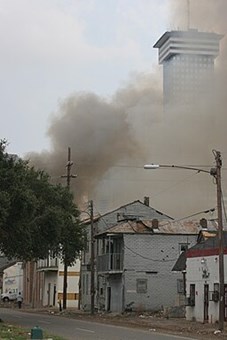
Fire in Post-Hurricane Katrina New Orleans
© Wikipedia Creative Commons
Xi Shao, Research Scientist, UMD/CISESS/ESSIC
CISESS scientists Wenhui Wang, Yan Bai, Xi Shao, Sirish Uprety, and Hong-Lie Qiu coauthored a paper “Combined Use of Satellite Observations and the RIM for Assessing Recovery from Natural Disasters” led by Dr. Changyong Cao of NOAA/NESDIS/STAR. The paper was recently published in Photogrammetric Engineering & Remote Sensing (DOI: 10.14358/PERS.24-00050R2). In this study, multiple satellite observations were used to assess community recovery from natural disasters such as fires and hurricanes, supplementing the Resilience Inference Model (RIM). The approach of integrating satellite observations can enhance recovery assessment with a shorter latency of weeks or months. Using fire, vegetation, and night light data from the Visible Infrared Imaging Radiometer Suite (VIIRS) with daily global observations, Sentinel-2, Landsat-8, and GOES/Advanced Baseline Imager, we quantitatively evaluated fire intensity, light outage, and urban greenness changes, along with subsequent recovery, focusing on the 2023 Maui fire (Fig. 1) and selected hurricane cases such as Ian (Fig. 2) and Ida along the Gulf Coast. The study augments the RIM model by incorporating satellite observations and related indices, such as urban greenness, night light intensity, Moran’s I index, and wildfire dynamics. These indicators complement the RIM model with more quantitative measures of damage, recovery, and resilience and can be used as indicators with a much shorter time frame of days or weeks instead of decades.
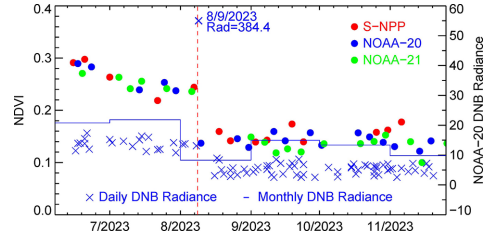
Figure 1:Time series of the urban greenness index at the hottest spot location of the August, 2023 Maui fire and the Day/Night Band (DNB) night light intensity at the shopping mall (location: 20.8780°, −156.6810°) in Lahaina. Red, blue, and green color dots represent VIIRS greenness index for S-NPP, NOAA-20, and NOAA-21, respectively; blue color “x” symbol represents daily NOAA-20 DNB radiance; blue solid line represents the monthly composite DNB mean radiance.
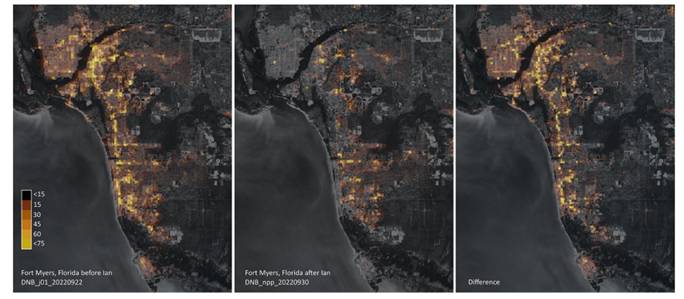
Figure 2: NOAA-20/S-NPP VIIRS detection of light outages in the Fort Myers area caused by Hurricane Ian. The left image is before the hurricane, the middle image is just after the hurricane, and the right image shows the light values of before minus after. The Landsat-8 image is used as background. The unit for DNB radiance is nW/(cm2-sr).
Citation: Cao, Changyong, Wenhui Wang, Yan Bai, Xi Shao, Sirish Uprety, and Hong-Lie Qiu, 2025: Combined use of satellite observations and the RIM for assessing recovery from natural disasters. Photogramm. Eng. Remote Sens., https://doi.org/10.14358/PERS.24-00050R2.
Some information from Maureen Cribb, CISESS Weekly Report to NOAA for 11 April 2025
« Back