NOAA Ship Data Assembly Center: Ready for Deployment
July 6, 2026 06:18 PM
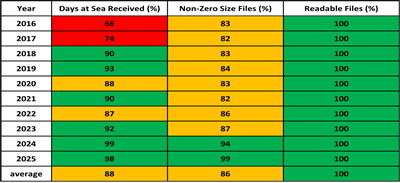
Table 1: Values represent the normalized values of all active ships in the fleet for each year.
© Hyelim Yoo, 2026 CISESS Annual Report and Slide
by Debra Baker
CISESS Scientist Hyelim Yoo works on the “Office of Marine and Aviation Operation (OMAO) Fleet Data Assembly Center Archive Study.” In her CISESS Annual Report and Slide, she highlights the impressive progress she and her NOAA Partner Chris Paver have made in setting up an NCEI Data Assembly Center (DAC). A DAC is responsible for acquiring, quality controlling, and making publicly accessible specific data.
OMAO maintains “the United State’s largest oceanographic research fleet” (Paver et al., 2020). These ships collect a wide variety of environmental data including air temperature, sea surface temperature, ocean bathymetry, wind speed and direction, ocean currents, and sea bottom depth (Paver et al. 2018). The goal of this CISESS project is to:
-
Develop systems of automated data pipelines to cover major data categories collected by the NOAA research ship;
-
Implement Quality Assessment (QA) and Quality Control (QC) procedures; and
-
Maximize the discoverability of this data.
(Yoo & Paver, 2025).
Table 1 (above) shows the progress that has been made since 2016. Color coding is a three-tiered system where 90-100 is green, 80-89 is yellow, and less than 80 is red (Hyelim Yoo, 2026 CISESS Annual Report and Slide). The early years of the project (2016-2017) faced challenges in data recovery with “Days at Sea Received” percentages dipping as low as 66%, while recent years (2024-2025) show peak recovery rates of 99% and 98%. The same upward trajectory can be seen in the “Non-Zero Size Files” category, which increased from an average of 83% to an 94% in 2024 and 99% in 2025. The successfully archived data is ready for end-users, with a 100% success rate for “Readable Files.”
The bar charts below provide more detailed information about the numbers listed in the table above. Figure 1 (left) shows the Project Days at Sea along with Expected Data and Archived Data and (right) shows file count data with zero-size files and readable files for each year.
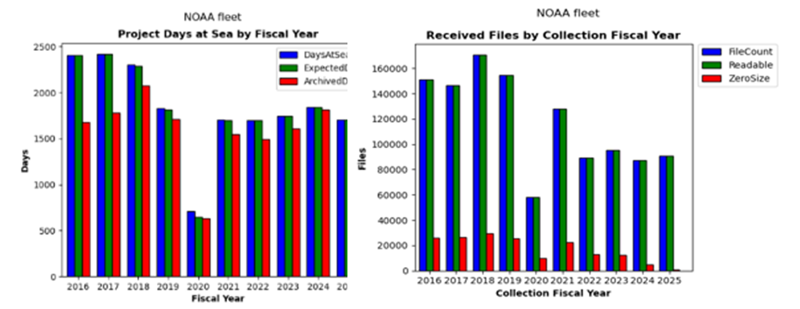
Figure 1: (Left) The bar chart reports the fleet days at sea metrics to include reported days at sea as marked a blue, days that data were expected with a green, and days where data were archived by NCEI with a red. (Right) The bar chart reports the fleet metrics to include total received file counts with a blue, readable files with a green, and zero size files with a red. Values in both tables represent the sum of all active ships in the fleet for each year.
The project focused on three main types of data and another two types were also worked with:
1. Scientific Computer System (SCS)
2. Acoustic Doppler Current Profiler (ADCP)
3. Conductivity, Temperature, Depth sensor (CTD)
4. Expendable Bathythermographs (XBTs)
5. Thermosalinographs (TSG)
(Yoo & Paver, 2025).
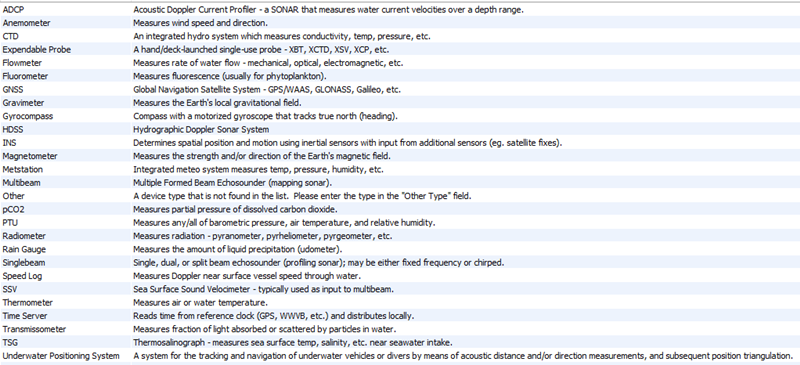
The Scientific Computer System (SCS) on NOAA ships was designed as a data acquisition and display system for oceanographic, atmospheric, and fisheries research applications. It can show scientists in real time via text and graphic displays sensor data from shipboard sensors. It also logs data for later analysis and performs some quality checks. It covers a wide range of shipboard sensors as shown in the list below.
Table 2: SCS Device List from the User’s Manual
An Acoustic Doppler Current Profiler (ADCP) uses sound waves to measure the speed and direction of currents throughout the water column. This helps scientists track how ocean water moves. By analyzing this data, we can get important information about the biological, chemical, and physical properties of the ocean. Below is the ADCP sensor on the left and a map showing data from it on the right.
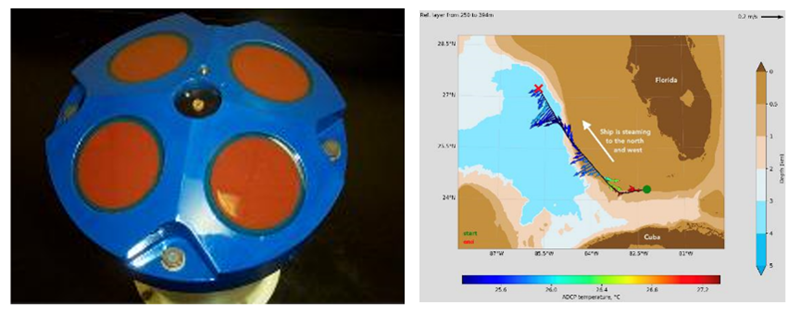
Figure 2: (Left) An Acoustic Doppler Current Profiler and (Right) a sample map of data from an ADCP from NOAA AOML.
A Conductivity, Temperature, Depth (CTD) sensor is an electronic devise that can detect how the ocean water conductivity and temperature changes with depth. On ships, a CTD is often attached to a larger metal water sampling array known as a rosette that is lowered into the water via a cable (left below) The output gives data for each depth the set-up passes through when in it is used (right below).
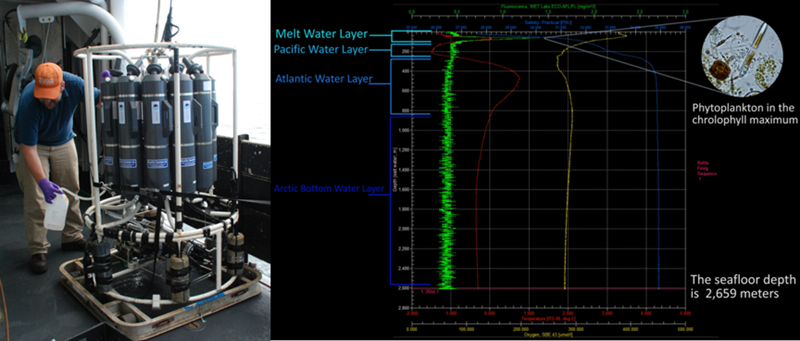
Figure 3: (Left) A CTD rosette [Image courtesy of DEEP SEARCH 2017, NOAA-OER/BOEM/USGS]. (Right) Data from a CTD used in the Arctic Sea. It shows the sea depth and the level with maximum chlorophyll due to phytoplankton.
An EXpendable BathyThermograph (XBT) is a sensor dropped from a plane or ship tht measures ocean temperature as a function of depth, from the surface to 350 m, at 1.5 m vertical intervals. This data provide information about the large scale circulation and the structure of ocean heat at different depths. The XBT instrument is shown below on the left and a sample of its output is shown on the right.
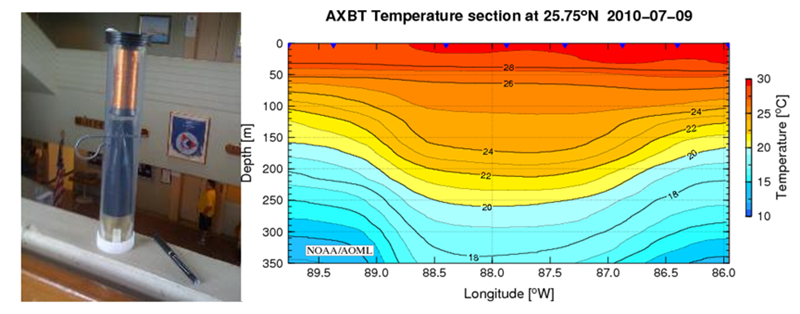
Figure 4: (Left) Photograph of an XBT probe. A very thin twin-wire connects the probe to the equipment on the ship. (Right) These are a temperature sections graph from an airborne XBT dropped in the Gulf of America for July 2010 at latitude 25.75°N
A Thermosalinograph (TSG) is a sensor that uses a water intake to measure sea surface temperature and salinity. This intake may be mounted on the ship and/or placed in a sensor array and lowered into the ocean. Salinity is derived from conductivity and temperature measured by a conductivity cell and a thermistor cell. The data on sea surface temperature is separated by the type of intake: inside the TSG (jacket temperature) and by “remote temperature sensors,” defined as a thermistor installed at the entrance of the seawater intake pipe attached to the ship. An example of a TSG is shown below on the left. On the right shows the location of all TSG observations for the latest 3 months, obtained from ships of the NOAA fleet and the SOOP (Ship of Opportunity Program).
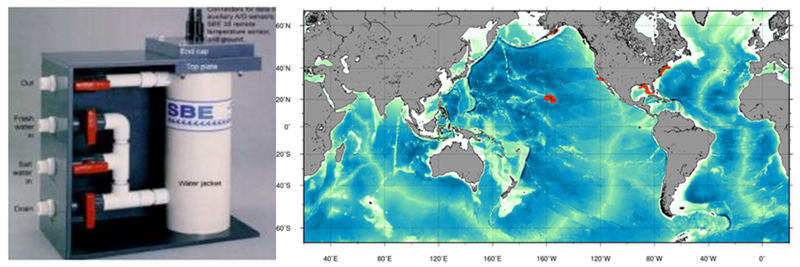
Figure 5: (Right) Overall view of the SBE 21 SEACAT TSG. (Right) NOAA TSG observations collected during the latest 90 days ( Feb 10, 2026 to May 11, 2026).
The workflows for the Data Assembly Center were adapted from the basic NCEI data flow process, shown below (Yoo & Paver, 2025).
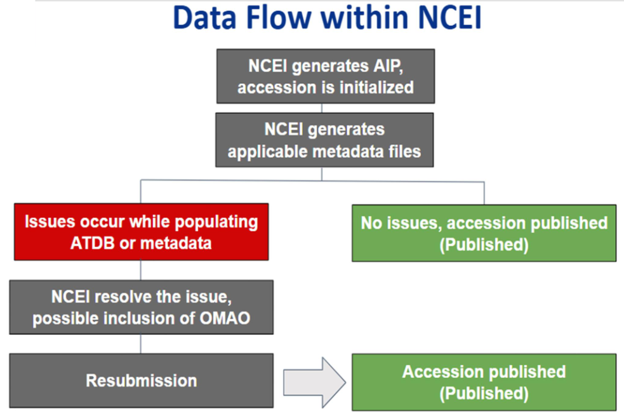
Figure 6: Flow diagram illustrating the sequence of data receipt and archiving at NCEI (Yoo & Paver, 2025).
The word “accession” is a special term at NCEI that refers to a unique set of scientific data that has been submitted, cataloged, and archived as a single unit. This may begin at an Application Programming Interface (AIP). NCEI has an Accession Tracking Data Base (ATDB) to keep track of original data in archival collections. Any data provided to NCEI is given a unique tracking number, called its “accession number.” This number can be used to find more information (“metadata”) about those collections through the NCEI Ocean Archive System (OAS).
Yoo and Paver developed separate workflows for the three major ship data types: SCS, ADCP and CTD.
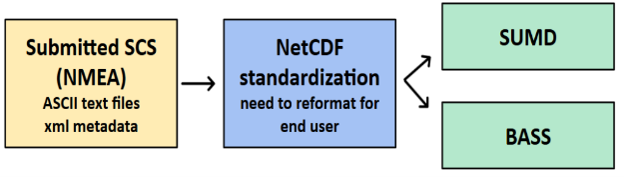
Figure 7: Worklow for Scientific Computer System data ingestion (Yoo & Paver, 2025).
The challenge for the accession of Scientific Computer System data is that it is in National Marine Electronics Association (NMEA) data format. To be compatible with the rest of the NCEI system, it must be converted into NetCDF (Network Common Data Form). This also increases accessibility of the data fir users. This conversion also includes metadata like spatial, temporal, and environmental information into single-file Net CDF outputs.
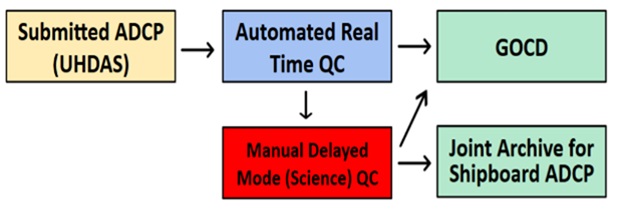
Figure 8: Worklow for Acoustic Doppler Current Profiler data ingestion (Yoo & Paver, 2025).
For Acoustic Doppler Current Profiler (ADCP) data, the focus has been on Quality Assessment and Quality Control. The automated pipeline incorporates some to evaluate the volume and integrity of submitted data. For example, data completeness is monitored daily by cross-referencing received files against the Ship Daily Activity Log to ensure all expected data has been transfered. However, there are still manual check, primarily aboard the ship.
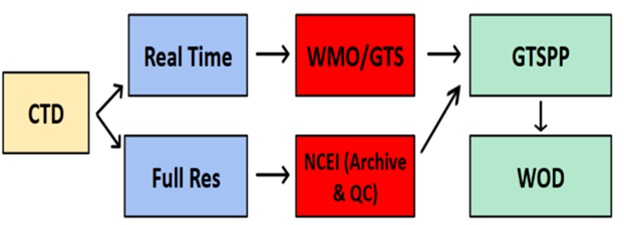
Figure 9: Worklow for Conductivity, Temperature, Depth data ingestion (Yoo & Paver, 2025).
The goal for the Conductivity, Temperature, Depth (CTD) data is to be able to ingest it and make available in real time. The data collected goes beyond the NOAA Fleet to include other sources provided through the World Meteorological Organization. According to the WMO, The Global Telecommunication System (GTS) is "The co-ordinated global system of telecommunication facilities and arrangements for the rapid collection, exchange and distribution of observations and processed information within the framework of the World Weather Watch."
The establishment of archiving procedures to different types of ship data over time is shown in the bar chart below. SCS data (blue) has been automatically archived to NCEI since 2010. Autoarchiving of ADCP data (orange) has been in place since 2021. The automated process for CTD data (green) started in 2023. (Yoo & Paver, 2025).
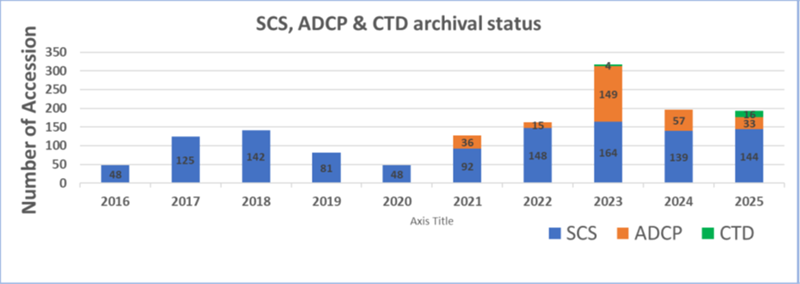
Figure 10: Number of accessions for SCS, ADCP, and CTD archival.
In 2025, 33 ADCP and 16 CTD accessions were made. These include records from a Data Rescue Project that were manually processed (4 ADCP accessions from the Bell M. Shimada and 29 ADCP, 16 CTD and some XBT accessions from the Gordon Gunter) .
The Green Boxes in the workflow diagrams above indicate the NCEI Products into which the automated ship data is incorporated:
-
The NCEI Surface Underway Marine Database (SUMD) is a comprehensive archive of in situ sea surface measurements from thermosalinographs, meteorological sensors and others from 1980 to the present. More than 450 ships and unmanned surface vehicles have contributed date to this database. There is also a long-term NCEI Archive of this data.
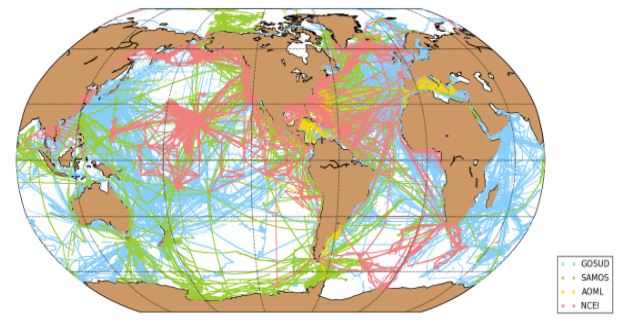
Figure 11: NCEI Surface Underway Marine Database geographic data distribution by providers. Courtesy of NOAA NCEI. GOSUD is Global Ocean Surface Underway Data and SAMOS is the Shipboard Automated Meteorological and Oceanographic System.
-
The Blended Analysis of Sea Surface Salinity (BASS) is a joint effort of the Climate Prediction Center, NESDIS/STAR, and NCEI. It is available as an ftp file (ftp.cpc.ncep.noaa.gov/precip/BASS). BASS is a blend of in situ measurements and bias-corrected satellite retrievals of sea surface salinity (SSS). Xie et al. 2022. CPC includes it in their Monthly Ocean Briefing.
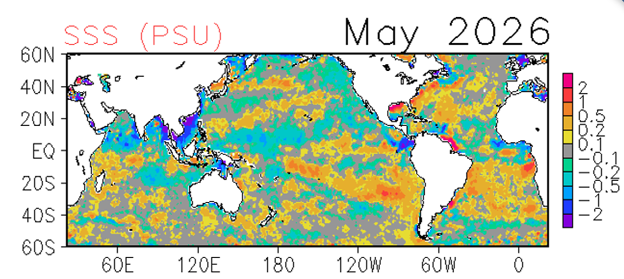
Figure 12: The graph above is BASS monthly global sea surface salinity (SSS) in practical salinity units (PSU) for May 2026 from: CPC Monthly Ocean Briefing (6-30-26)
-
The Global Ocean Currents Database (GOCD): NCEI decommissioned the GOCD in April 2025 with no further updates.
-
The Global Temperature and Salinity Profile Programme (GTSPP) is an accurate, up-to-date ocean temperature and salinity archive for researchers and marine operations managers. It was developed by a group of international marine and oceanic science organizations. The program is jointly managed by the World Meteorological Organization (WMO) and the Intergovernmental Oceanographic Commission (IOC), with NCEI providing long-term storage and quality control services so the data is preserved and made available to researcher and the public.
-
The World Ocean Database (WOD) is “the world's largest collection of uniformly formatted, quality controlled, publicly available ocean profile data.” (CISESS Scientist Alexey Mishonov works on the WOD).
OMAO DAC is evaluating the inclusion of this data into other existing NCEI products.
Yoo and Paver have also developed a specialized portal for the OMAO DAC data archives, called the Cruise Catalog.
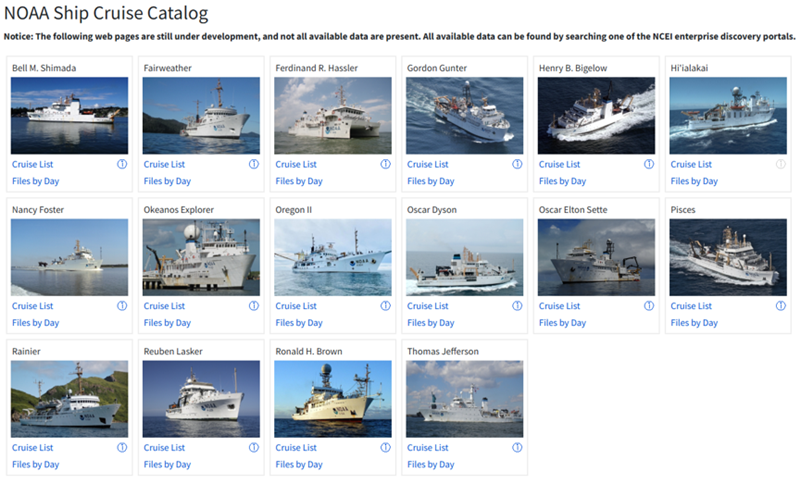
Figure 13: Public access to OMAO DAC data is through the NOAA Ship Cruise Catalog.
The Cruise Catalog provides access to archived SCS, ADCP, and soon to come, CTD data submitted by OMAO DAC is currently upgrading its software infrastructure to enhance the precision and accessiblity of the Cruise Catalog. The backbone of this portal is the cruise-level metadata records developed by the project. This framework ensures that every cruise-level record is populated with high-fidelity spatiotemporal context and standardized project identifiers (Yoo & Paver, 2025). The portal will eventually include post-processed cruise as well as data from other providers (Paver et al., 2020).
The NOAA Okeanos Explorer Ship also has its own NOAA Ocean Exploration Data Atlas: (part of CISESS Scientist Anna Leinesch’s project at NCEI).
NCEI has a large number of data portals for NOAA Ocean Exploration data including:
Check out NOAA’s OneStop Dataset Search Page, which has a new enhanced design unvelied on July 7!
The OMAO DAC is ready for deployment! While only the SCS automated archival pipeline is currently 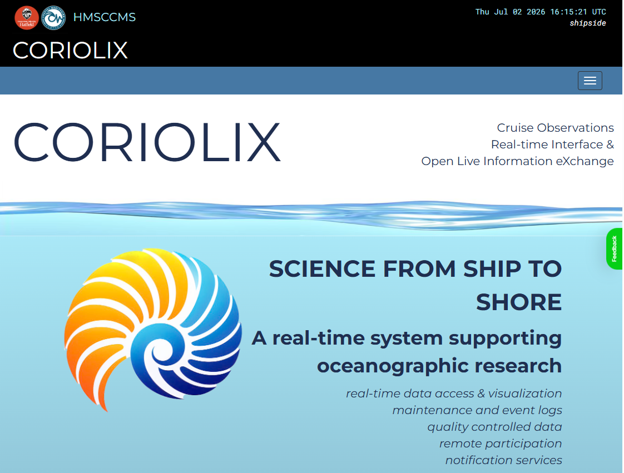 operational, automated pipelines for ADCP and CTD data have been tested and are ready to go. The project is paused while NOAA implements a successor to the OMAO Scientific Computer System called CORIOLIX. The Cruise Observations Real-time Interface & Open Live Information eXchange is “a specialized distributed software system used primarily on oceanographic research vessels to log, visualize, and manage scientific and meteorological sensor data in real-time.”
Source: Hyelim Yoo, 2026 CISESS Annual Report and Slide.
Othere Sources
CPC, Monthly Ocean Briefing, 10 June 2026: Global Ocean Monitoring: Recent Evolution, Current Status, and Predictions, https://www.cpc.ncep.noaa.gov/products/GODAS/ .
Paver, Chris; Solomon Tadele and Fred Katz, 2020: NOAA/NCEI Data Assembly Center for NOAA/OMAO's Ship and Aircraft Fleet. Ocean Sciences Meeting, San Diego, CA, 16-21 February 2020, Abstract # OD44C-351, https://ui.adsabs.harvard.edu/abs/2020AGUOSOD44C351PA/abstract .
Paver, Chris; Fred Katz, and Paul Murphy, 2018: NOAA/NCEI Data Assembly Center for NOAA/OMAO's Ship and Aircraft Fleet. American Geophysical Union Fall Meeting, Abstract #IN31D-0840, https://ui.adsabs.harvard.edu/abs/2018AGUFMIN31D0840P/abstract .
Xie, Pingping, Li Ren, Guangyang Fang, and Arun Kumar, 2022: Operational Monitoring of the Global Sea-Surface Salinity and Fresh Water Flux with In Situ and Satellite Observations. 2022 Ocean Salinity Conference, 9 June 2022, https://salinity.oceansciences.org/docs/ocean_salinity_2022/osc22_xie.pdf.
Yoo, Hyelim, and Chris Paver 2026: Modernizing Access to NOAA Fleet Data: Metadata Integration, NetCDF Standardization, and Cruise Catalog Improvements (poster). Ocean Science Meeting, Glasgow, Scotland, UK, February 22-27, 2026, http://osm26.ipostersessions.com/Default.aspx?s=1E-EF-17-81-D2-3E-3B-59-60-38-60-D0-46-57-16-5E.
*Bold-CISESS & Underline-NOAA
[Google Gemini helped me track down some of the acronyms and sources.]
« Back