NOAA Soil Moisture Operational Product System (SMOPS): New Products & Applications
July 6, 2026 12:59 PM
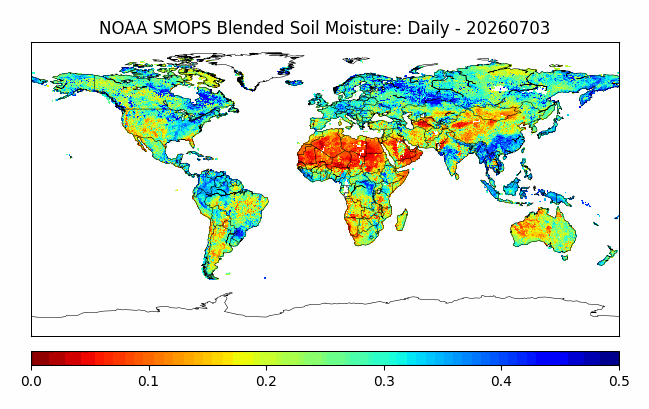
Figure 1: NOAA MOPS Blended Soil Moisture: Daily for 3 July 2026
© NOAA NESDIS STAR
By Debra Baker
CISESS Scientist Jifu Yin worked on five CISESS soil moisture projects over the last year, which he summarized in his 2026 CISESS Annual Reports and Slides. This article will discuss his major accomplishments this year, which included:
-
Developing Version 5 of the near-real time soil moisture product in the NOAA Soil Moisture Operational Product System (SMOPS), known as SMOPSnrt;
-
Making progress on the new high resolution soil moisture products (SMOPShr), which will increase the spatial resolution from 25 km to 1 km; and
-
Preparing SMOPS for the integration of new satellite data fo GOSAT-GW and WSF-M, as well as seeking funding to add the NISAR satellite.
His most important contribution to NOAA was to integrate SMOPS products (see Figure 1) with the Land Surface Data Assimilation for the new Unified Forecast System in collaboration with the EPIC project. He also spent time pushing the science of satellite soil moisture measurements by testing the use of P-Band radiometers to measure root zone soil moisture.
Soil Moisture as a Critical Variable
Soil moisture is a key variable in the hydrological cycle with important effects in both the land and atmosphere. It plays a signficant role in the exchange of water, energy, and carbon between the land and the atmosphere.https://cisess-umd.ae-admin.com/assets/1/7/MainFCKEditorDimension/Soil_Cycle.png Soil moisture is a critical variable for numerical weather prediction, hydrological and environmentalmodels. High soil moisture is associated with more precipitation, and low soil moisture is associated with less precipitation, 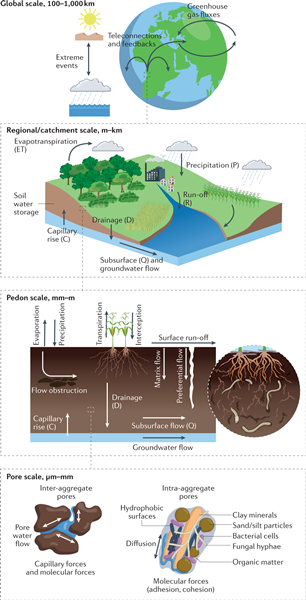 with both situations leading to positive feedback effects. As a result, reliable soil moisture information can aid prediction of seasonal streamflow and droughts several months in advance. Soil moisture also impacts plant growth so it can also be used to predict wildfire risks. (Yin et al., 2026).
According to Vereecken et al. 2022, “Soil hydrological processes (SHP) support ecosystems, modulate the impact of climate change on terrestrial systems and control feedback mechanisms between water, energy and biogeochemical cycles.” Figure 2 on the right shows the important drivers of SHP on different scales:
-
Global Scale SHP are affected by extreme weather events and climate-change effects;
-
Regional-scale SHP are affected by floods, drought, heatwaves, and land-use changes; and
-
Local-scale SHP are affected by root water uptake, vegetation and groundwater dynamics.
CISESS and NOAA focus scientific research on soil moisture because the prediction of droughts, floods, and other environmental hazards can be improved by providing more complete and timelier soil moisture information. Accurate SM data also supports water managers, forecastors, and other decision-makers to aid environmental resilience and public safety (Yin et al., 2026).
Figure 2: Soil Hydrological Processes (Vereecken et al. 2022).
NOAA Soil Moisture Operational Product System (SMOPS)
CISESS Scientist Jifu Yin helped to develop the Soil Moisture Operational Products System (SMOPS) for NOAA/NESDIS. The SMOPS project began in 2011 because NOAA wanted to high quality soil moisture inputs for its numerical weather prediction model to improve model forecasting (see Yin et al. 2019). SMOPS blends multi-satellite sensor observations to produce global soil moisture operational products. This system serves as NOAA’s “one-stop shop” for all available microwave satellite soil moisture observations. Its objective is to collect satellite data on land surface soil moisture from low-frequency microwave instruments. By blending several satellite measurements, it provides better spatial coverage. SMOPS is unique because it provides globally blended data in near real time to be ahead of the 6-hour cutoff time requirements of operational weather forecast models (Yin et al., 2026).
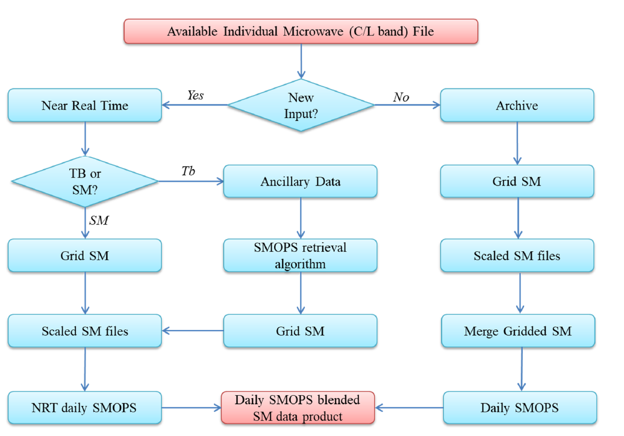
Figure 3:Processing flow of the daily SMOPS blended soil moisture data product. The abbreviations SM indicates soil moisture and TB indicates brightness temperature (Yin, Zhan, & Liu, 2020). See Figure 1for the data product.
The SMOPS process is shown above in Figure 3. For more information on the algorithm and the Algorithm Theoretical Basis Document, see the OSPO SMOPS Website.
Yin currently has four soil moisture products he has developed for SMOPS. The first SMOPS products are 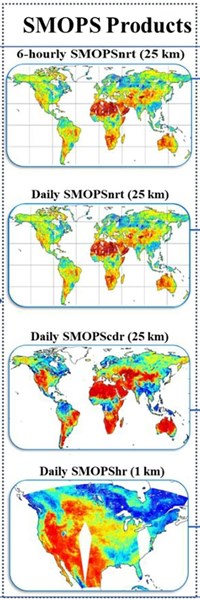 now called the near-real-time soil moisture products: SMOPSnrt (see Figure 4, top two maps). They are produced every 6 hours and on a daily basis on a global map with 25 km resolution. The 6-hour product(00Z, 06Z, 12Z, and 18Z) is available within three hours of the observations, a period called “latency time.”The daily products is made available with a 24-hour latency time (Yin, Zhan, & Liu, 2020).
The changes over time in satellite input and algorithms to SMOPS to improve its near-real time products resulted in some inconsistencies over the long-term. As a result, a reprocessed consistent climate date record (CDR) version was developed called SMOPScdr (see Figure 4, top of bottom half). It is also on a 25 km global grid and is produced with a latency time of 1 year, to focus on quality rather than speed. The current archive of SMOPScdr is from 2002 to 2025. The spatial coverage and accuracy of these maps is also improved. SMOPScdr is designed for weather and climate research (Yin, Zhan, Liu, et al., 2025).
Yin is currently developing a new product with higher resolution called (SMOPShr) (see Figure 4, bottom). It was created in response to regional modelers who want higher resolution soil moisture for initial analaysis and data assimilarion. SMOPShr begins with the Daily nrtSMOPS and is then downscaled from 25 km to 1 km spatial resolution. It will be produced on an extended CONUS map with a 24-hour latency, so it will also a near-real-time product. It will also support the NOAA’s National Water Model (Yin, Zhan, Ogden et al. 2025).
The quality of these products has steadily inproved since 2011 and they have shown satisfactory consistency with their SMAP satellite benchmark. According to Yin, work on SMOPS products has concentrated on “improving data accuracy, validating product quality, supporting operational applications, and advancing scientific studies” (Yin et al., 2026).
Figure 4: SMOPS that includes 6-hourly near real-time SMOPS (SMOPSnrt), daily SMOPSnrt, daily SMOPS climate data record (SMOPScdr), and daily high-resolution SMOPS (SMOPShr) products (Yin et al., 2026)
Satellite Soil Moisture Measurements
While there are several networks of in situ soil moisture monitors, their limited coverage and inconsistent sensor output make this data difficult to use to investigate land-atmosphere interactions. In comparison, satellite remote sensing offers distinct advantages with its global scale and consistent spatial coverage. (Yin et al., 2026).
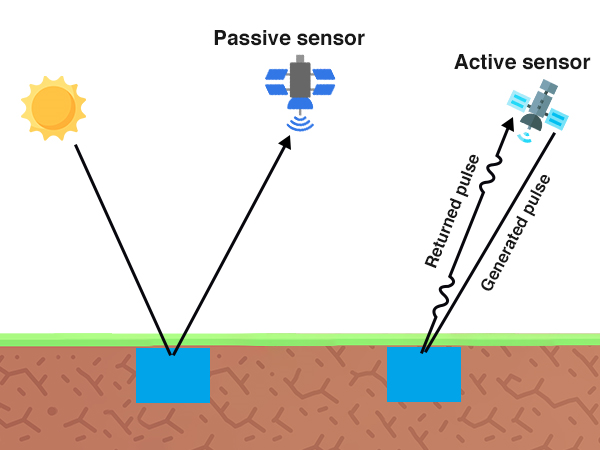
Figure 5: Microwave Remote Sensing is broadly divided into two types - Passive and Active, from Everything RF: What is Microwave Remote Sensing?
Satellites use microwave sensors to directly measure the soil dielelectric constant that connects soil moisture and soil emissivity. As shown above, there are two types of microwave sensors. Most satellites that measure soil moisture use passive microwave radiometers that collect reflected microwave radiation. However, newer satellites are using active sensors like synthetic aperture radar. One big advantage of using microwave sensors is that they can collect data through clouds, reducing data gaps.
SMOPS is entirely dependent on satellite data input for its products. Yin has worked with a full range ofsatellites to keep SMOPS on the cutting edge of soil moisture remote sensing (see Figure 6).
SMOPS has incorporated retrievals from the two satellite soil moisture missions: Soil Moisture and Ocean 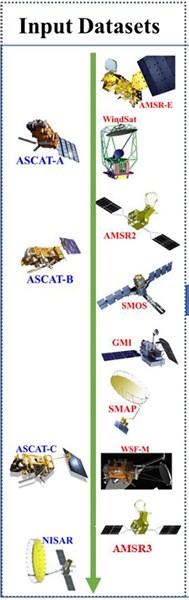 Salinity (SMOS) and Soil Moisture Active and Passive (SMAP). These satellites sense soil moisture using the L-band microwave passive remote sensing technique.
Passive advanced microwave scanning radiometers (AMSR) have been used to collect data for SMOPS: including the AMSR-Eon the Aqua Satellite and AMSR2 on Global Change Observation Mission 1st - Water (GCOM-W1) Satellite satellite from JAXA. SMOPS has also included data from the Wind Satellite polarimetric passive radiometry (WindSat) on the Coriolis satellite (DoW).
SMOPS also has ingested observations from advanced scatterometers (ASCAT-A, -B, -C) onboard the ESA meteorological operation satellites (MetOp-A, -B, -C). These measures soil moisture using active microwave remote sensing. It has taken data from the Global Precipitation Measurement (GPM) Microwave Imager (GMI).
Currently, SMOPs combines data from AMSR2, ASCAT-B & -C, GMI, and SMAP.
Yin has worked on projects in the last year to add two more satellites:
-
Global Observing Satellite for Greenhouse Gases and Water Cycle (GOSAT-GW) with AMSR3, launched in June 2025 (Jifu Yin 2026c); and
-
Weather System Follow-on - Microwave satellite (WSF-M), launched in April 2024. (Jifu Yin 2026e).
Now a project for a third satellite addition has just been approved for funding: the NASA-ISRO Synthetic Aperture Radar satellite (NISAR), launched in July 2025. This the first satellite to combine L-band and S-band radar on a single platform. The valuable L-band SAR SM at fine resolution will improve SMOPS spatial resolution.
Figure 6: The satellites from which soil moisture observations have been ingested into the SMOPS system, starting with the oldest satellites on top and the new satellites waiting to be added to SMOPS at the bottom (Yin et al., 2026).
AI/Machine Learning Improvements to SMOPS
Jifu Yin has been one of the most active CISESS scientists in using artificial intelligence and machine learning to enhance his work on NOAA projects. He has incorporated machine learning in the SMOPS system to ensure its independence from SMAP, the product benchmark. It allows SMOPS to offer quality historical and near real-time products even when SMAP is not available. His early work compared the six commonly used machine-learning models including multiple linear regression, regression tree , random forest , gradient boosting, extreme gradient boosting, and artificial neural networks. He found a clear winner for his soil moisture data: extreme gradient boosting (XGB) (Yin et al. 2023). The chart below is an infographic of how XGB works (Figure 7).
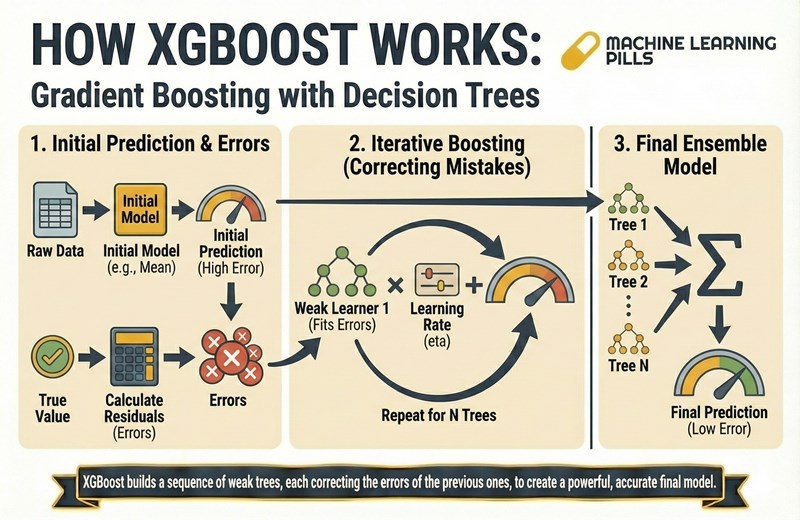
Figure 7: A summary the machine learning techniqueextreme gradient boosting (XGB) from: David Andrés, Machine Learning Pills: #113 – Interpreting XGBoost Predictions(SubStack Blog, 11-30-25).
Yin has worked on four major machine learning projects over the last year for SMOPScdr, SMOPShr, the transition from AMSR2 to AMSR3, and adding the WSF-M satellite.
-
The SMOP Data Climate Record reprocessing doesn’t start with the daily SMOPSnrt. Instead, the brightness temperature (Tb) is retrieved from all available individual satellite observations. The soil moisture observations are then determined from Tb by the machine learning model. Using XGB increases the accuracy compared to traditional retrieval methods. Validation studies show that the machine model soil moisture output has higher correlation coefficients and lower root mean square error when compared to the SMAP benchmark than the original soil moisture products from each satellite (Yin, Zhan, Liu et al. 2025).
-
For High Resolution SMOPS, a machine learning model is used to downscale the SMOPs 25km product to produce the 1km SMOPShr. The XGB model uses regridded 1-km the AMSR Ka-band Tb observations for downscaling. Land surface temperature (LST) is a critical variable in developing the downscaled soil moisture based in the assumption that limited soil moisture raises LST by restricting evapotranspiration and unlimited soil moisture corresponds to maximum evapotranspiration. The spatial patterns of the XGB-based 1 km SMOPShr match the original 25 km SMOPS, while revealing finer spatial details (Yin, Zhan, Ogden et al. 2025).
-
To align AMSR3 to AMSR2 as a means of ensuring a continuous consistent soil moisture record, Yin developed a robust regression model to simulate the relationship between the grid-paired Tb observations from the simultaneous overpasses for both satellites. Statistics show the correlation coefficients between AMSR3 and AMSR2 are generally greater than 0.98, which indicates that the AMSR3 Tb observations have been successfully scaled to AMSR2 Tb datasets at the gridded pixel level (Jifu Yin 2026b).
-
To incorporate WSF-M Satellite observations into SMOPS, Yin developed a machine learning model for producing the NOAA WSF-M soil moisture retrievals. For this satellite, he is using brightness temperature from the X-band (8.0–12.0 GHz), C-band (4.0–8.0 GHz), and L-band (1.0–2.0 GHz) channels. Comparison of monthly mean ascending and descending WSF-M soil moisture retrievals with the corresponding reference SMAP datasets for September 2025 indicate that the developed soil moisture retrievals agree well with SMAP observations (Jifu Yin 2025e).
Data Assimilation Applications for SMOPS
Soil moisture products from SMOPS are used for many operational and scientific applications. including weather forecasting, climate research, hydrological prediction, and environmental decision-making (Yin et al., 2026). The most recent work at CISESS has been on SMOPS for data assimilation (Jifu Yin 2026a). Yin was an early advocate of soil moisture data assimilation with a paper in 2014 (Yin et al. 2014).
This year, through collaboration with NOAA’s Earth Prediction Innovation Center ((EPIC), SMOPS has been integrated into the National Weather Service’s United Forecast System (UFS) Land Data Assimilation framework (Jifu Yin 2026a). EPIC has just released Version 3.0.0 of the UFS Land DA System, with major improvements in workflow automation and usability and expanded data ingestion and modeling capabilities (see Figure 8).
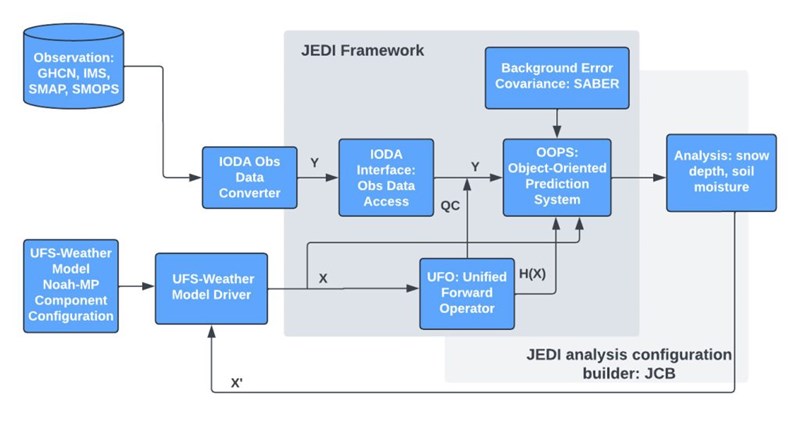
Figure 8. JEDI‑based Land DA workflow in the UFS Land DA System version 3, showing how land‑surface data, including SMOPS, SMAP, and IMS (Interactive Multi-Sensor Snow and Ice System), move through the JEDI (Joint Effort for Data Assimilation Integration) system and interact with the Noah‑MP (Multi-Parameterization) Land Surface Model.
The new release enables assimilation of SMOPS data using advanced ensemble-based and hybrid data assimilation techniques that optimally merge satellite-derived soil moisture with model background states (see Figure 9). Biases are corrected and surface moisture information is propagated vertically through model soil layers. This process improves the of land surface initialization and enhances land–atmosphere coupling. The objective is to improve forecasts of near-surface temperature and humidity, planetary boundary layer development, and precipitation. As reported recently in EPIC News , the Land-DA System “leverages SMOPS’ multi-sensor blending to provide more spatially complete and temporally consistent updates, reducing data gaps and improving forecast stability across cycles.”
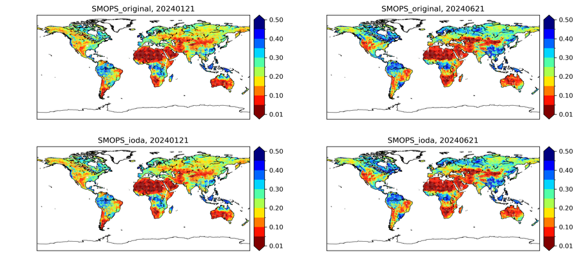
Figure 9. Blended satellite soil moisture data products (top row) from NESDIS Soil Moisture Operational Product System (SMOPS) are successfully ingested into NWS UFS Land-DA framework as the required data (bottom row) for their assimilation into the UFS. (Jifu Yin 2026a).
Land DA System v 3also support experimental configurations, future soil‑moisture analysis, and H(x) forward-operator evaluation mode. An H(x) forward-operator evaluation mode is a tool used in diagnostic evaluation for scientific modeling and data assimilation. It can evaluate if a forecast matches real-world instrument data by translating theoretical model states (x) into the space of observable measurements (H). Figure 10 (below) shows an H(x) evaluation for one day of soil moisture data.
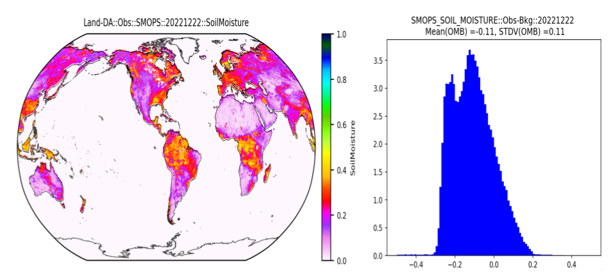
Figure 10. Example of the Land DA System-based H(x) capability for SMOPS on 12/22/2022. (Left) Satellite derived global soil moisture map from SMOPS (Right) Density histogram of the difference between SMOPS observation and the model background soil moisture (Mean∓ SD = -0.11∓ 0.11) (Jifu Yin 2026a).
SMOPS Data Management
SMOPS soil moisture products have units of Volumetric Soil Moisture Content [m3 water/m3 soil] (STAR SMOPS Website).
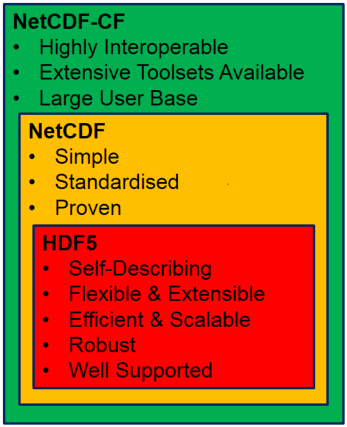 All SMOPS products are converted from the common NetCDF to NetCDF-CF files using the climate and forecast (CF) metadata conventions. This makes the datasets self-describing to meet the data format requirements of the users (Yin et al., 2026).Figure 11 highlights the different proporties of NetCDF-CF compared to NetCDF.
For the data assimilation effort described above for the UFS model, Yin had to develop a converter to change SMOPS products into the Interface for Observation Data Access (IODA). This is the format used in NOAA’s major data assimilation platform: Joint Effort for Data Assimilation Integration (JEDI) (Jifu Yin 2026a). IODA SMOPS files are needed for observation formatting and processing and H(x) evaluations (see Figure 8 above) (Yin et al., 2026).
Figure 11: The key differences between NetCDF and NetCDF-CF. (Ip et al. 2019).
The operational SMOPS products can be accessed on the
STAR also has a SMOPS Portal - Near-Real Time Viewer (see Figure 12) (Yin et al., 2026).
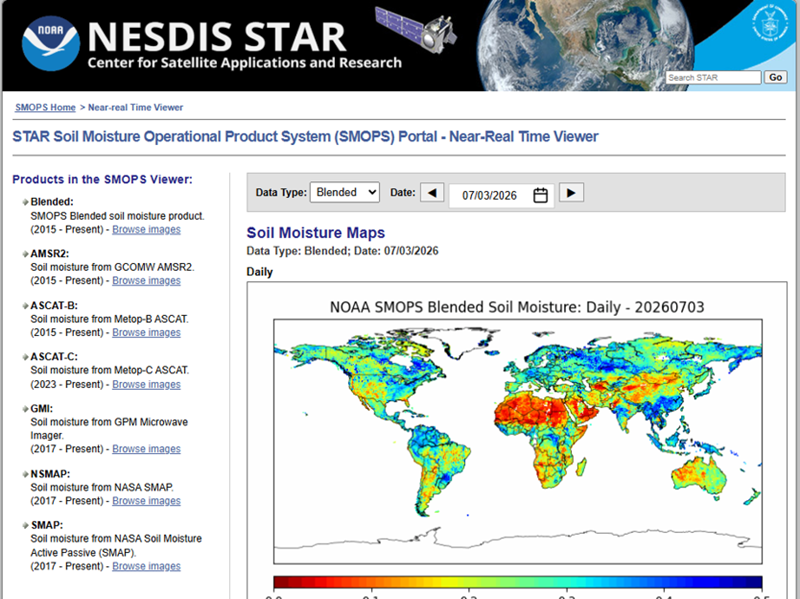
Figure 12:The STAR SMOPS Portal
Satellite P Bands
In addition to his work on SMOPS, CISESS Scientist Jifu Yin, has also been extending the science of satellite soil moisture observations. Yin investigated the capabilities and opportunities of using P-band passive microwave brightness temperature observations to measure soil moisture. This type of sensor has been found to provide useful data on snow melt and root-zone soil moisture (see Figure 13) (Yin, Liu & Zhan, 2025).
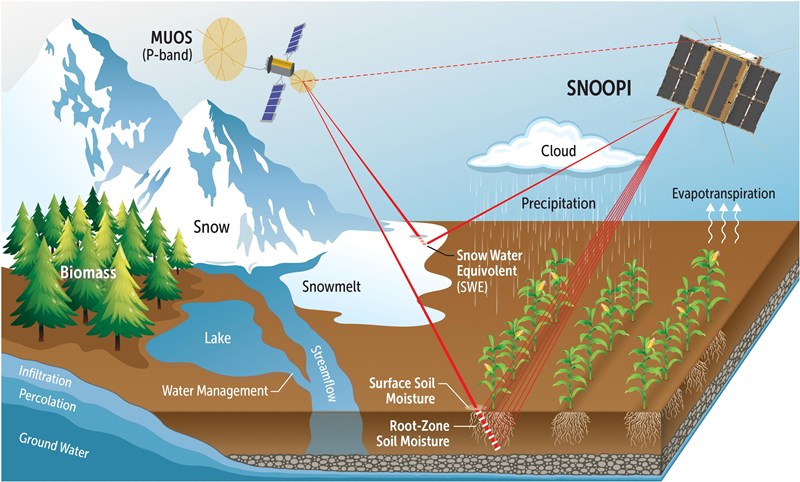
Figure 13: P-band signals represent an emerging technique for the direct measurement of two critical water cycle variables including Root-Zone Soil Moisture (RZSM) and Snow Water Equivalent (SWE) (Garrison et al., 2024 in Yin, Liu & Zhan, 2025).
Yin collected P-band (0.75 GHz) brightness temperature data from the SigNals-Of-Opportunity P-band Investigation (SNOOPI). His results show that P-band radiometer brightness temperature observations exhibit stronger correlations with soil moisture observations from 0-5 cm down to 35-40 cm soil layers than those from L-band (1.413GHz) radiometer, proving the promises of P-band sensing of soil moisture. One of his interesting findings was that the representativeness of soil moisture conditions is substantially influenced by incidence angle. Compared to horizontal polarization, P-band Tb at vertical polarization effectively capture the 0-40 cm soil moisture status (Jifu Yin 2026d).
Future Work
In the new year, SMOPS users can look forward to further improvements.
-
The newest release (version 5.0) of SMOPSnrt is expected to release to public in 2026 (SeeFigure 14).
-
The development of 1 km SMOPShr is still ongoing and is scheduled for public release in 2027 (Yin, Zhan, Ogden,et al., 2025).
-
SMOPS will continue to be upgraded by including new satellite sensors: AMSR3 on GOSAT-GW, WSF-M, and NISAR.
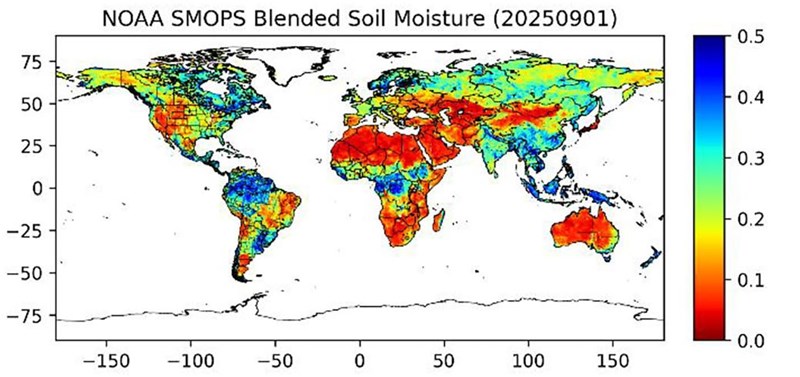
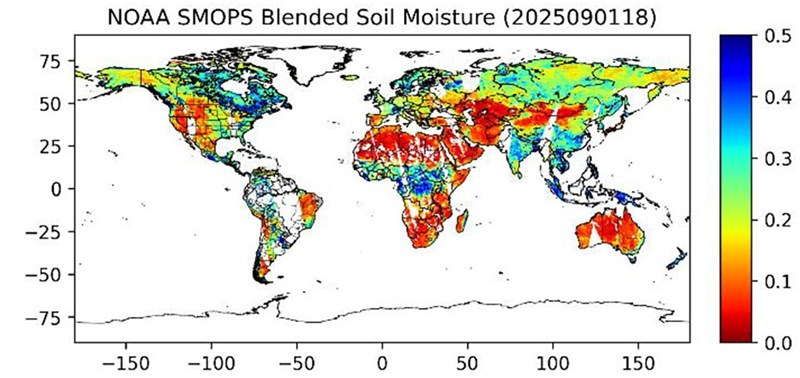
Figure 14: Previews of the new version 5 of the near-real-time SMOPS daily soil moisture (top) and 6-hourly soil moisture (bottom) (Yin et al., 2026).
Jifu Yin also has a new article in the Vadose Zone Journal, published online on July 1, which describes SMOPS and its applications, strengths, limitations, and future directions. He says, “This paper introduces SMOPS to the community and encourages user engagement in shaping its future development” See: Jifu Yin, Xiwu Zhan, Jicheng Liu, Jong Kim, Chan-Hoo Jeon, and Gillian Petro, 2026: National Oceanic and Atmospheric Administration Soil Moisture Operational Product System: An overview and data assimilation applications. Vadose Zone J., 25, e70122, https://doi.org/10.1002/vzj2.70122
SOURCES
Jifu Yin 2026a CISESS Annual Report and Slide for Assimilation of Satellite Land Surface Data Products via the NOAA EPIC UFS Land Data Assimilation (DA) System.
Jifu Yin 2026b CISESS Annual Report and Slide for GCOM- AMSR-3 Soil Moisture Product Development and Validation 2024.
Jifu Yin 2026c CISESS Annual Report and Slide for GCOM-W1 Soil Moisture Product Calibration and AMSR3 Preparation 2025.
Jifu Yin 2026d CISESS Annual Report and Slide for SNOOPI Data Exploitation for Root Zone Soil Moisture Mapping 2024.
Jifu Yin 2026e CISESS Annual Report and Slide for Ingesting Soil Moisture Retrieval from the Microwave Imager on DoD Weather Satellite Follow-on Mission (WSF-M) into NESDIS Soil Moisture Operational Product System (SMOPS) 2025.
Jifu Yin, Xiwu Zhan, Jicheng Liu, Jong Kim, Chan-Hoo Jeon, and Gillian Petro, 2026: National Oceanic and Atmospheric Administration Soil Moisture Operational Product System: An overview and data assimilation applications. Vadose Zone J., 25, e70122, https://doi.org/10.1002/vzj2.70122.
OTHER SOURCES
Garrison, James L.; Manuel A. Vega, Rashmi Shah, Justin R. Mansell, Benjamin Nold, Juan Raymond, Roger Banting, Rajat Bindlish, Kameron Larsen, Seho Kim, Weihang Li, Mehmet Kurum, Jeffrey Piepmeier, Hasnaa Khalifi, Forrest A. Tanner, Kevin Horgan, Chase E. Kielbasa, and Sachidananda R. Babu, 2024: SNOOPI: Demonstrating Earth remote sensing using P-band signals of opportunity (SoOp) on a CubeSat. Adv. Space Res., 73(6), 2855–2879, https://doi.org/10.1016/j.asr.2023.10.050.
Ip, Alex; Andrew Turner, Yvette Poudjom-Djomani, Ross C Brodie, Phillip Wynne, Kelsey Druken, Neil Symington & Carina Kemp, 2019: Discovering and using geophysical data in the 21st century, ASEG Extended Abstracts, 2019:1, 1-6, https://doi.org/10.1080/22020586.2019.12073191.
Vereecken, Harry; Wulf Amelung, Sara L. Bauke, Heye Bogena, Nicolas Brüggemann, Carsten Montzka, Jan Vanderborght, Michel Bechtold, Günter Blöschl, Andrea Carminati, Mathieu Javaux, Alexandra G. Konings, Jürgen Kusche, Insa Neuweiler, Dani Or, Susan Steele-Dunne, Anne Verhoef, Michael Young & Yonggen Zhang, 2022: Soil hydrology in the Earth system. Nat Rev Earth Environ 3, 573–587, https://doi.org/10.1038/s43017-022-00324-6
Yin, Jifu; Christopher R. Hain, Xiwu Zhan, Jiarui Dong and Michael Ek, 2019: Improvements in the forecasts of near-surface variables in the global forecast system (GFS) via assimilating ASCAT soil moisture retrievals. J. Hydrol, 578, 124018, https://doi.org/10.1016/j.jhydrol.2019.124018.
Yin, Jifu; Jicheng Liu and Xiwu Zhan, 2025: SNOOPI Data Exploitation Study Objectives and Benefits Deliverables Summary Report (NOAA Technical Report: 25 July 2025), https://doi.org/10.25923/3a5z-7z45 .
Yin, Jifu; Xiwu Zhan and Jicheng Liu, 2020: NOAA satellite soil moisture operational product system (SMOPS) version 3.0 generates higher accuracy blended satellite soil moisture. Remote Sens., 12, 2861, https://doi.org/10.3390/rs12172861.
Yin, Jifu; Xiwu Zhan, Fred L. Ogden, Michael Barlage, Huan Meng, Satya Kalluri, Jicheng Liu, and Ralph R. Ferraro, 2025: Development of a NOAA one-kilometer resolution SMOPS climate data record. 105th Annual Meeting of the American Meteorological Society, New Orleans, LA, 12-16 January 2025, No. 452580, https://ui.adsabs.harvard.edu/abs/2025AMS...10552580Y/abstract.
Yin, Jifu; Xiwu Zhan, Jicheng Liu, Michael Barlage, Huan Meng, Satya Kalluri, John Xun Yang, Fred L. Ogden, Mitchell D. Goldberg, Limin Zhao, Michael Cosh, and Ralph R. Ferraro, 2025: Reprocessed NOAA SMOPS blended soil moisture product as a climate data record. Bull. Amer. Meteor. Soc., 106(8), E1601–E1619, https://doi.org/10.1175/BAMSD-23-0248.1.
Yin, Jifu; Xiwu Zhan, Youfei Zheng, Jicheng Liu, Christopher R. Hain and Li Fang, 2014: Impact of quality control of satellite soil moisture data on their assimilation into land surface model. Geophys. Res. Lett., 41, 7159–7166, https://doi.org/10.1002/2014GL060659.
Yin, Jifu; Xiwu Zhan, Youfei Zheng, Jicheng Liu, Li Fang, and Christopher R. Hain, 2015: Enhancing model skill by assimilating SMOPS blended soil moisture product into Noah land surface model. J. Hydrol, 16, 917–93, https://doi.org/10.1175/JHMD-14-0070.1.
*Bold-CISESS & Underline-NOAA
« Back