Development of SAR Altimeter Capability
Research Topic:
Earth System Modeling from Satellites
Task Leader:
Alejandro Egido
CICS Scientist:
Alejandro Egido
Sponsor:
NESDIS STAR SOCD OPB LSA
Published Date:
9/26/2017
2017 ANNUAL REPORT
Background
From Geos-3 in 1975 until CryoSat in 2010, all satellite radar altimeters employed the same technology, called here “conventional” or “LRM” (Low Resolution Mode). This scheme employs radar pulses at low (~2 kHz) pulse repetition frequencies (PRFs) and simple, incoherent averaging (averaging power without regard to phase) to obtain estimates of elevation (sea level), surface roughness (wave height), and backscatter (related to wind speed) averaged over a circular patch of Earth’s surface a few km in diameter known as the pulse-limited footprint. CryoSat and Sentinel-3 operate in this fashion over much of the ocean but can also operate in two new, high-resolution modes. These modes employ a much higher (~18 kHz) PRF and coherent processing (meaning the phase of each complex radar echo is exploited) to narrow the measurement area in the along-track direction by the same Doppler beam sharpening as is used in side-looking imaging synthetic aperture radars (SAR). This technique is known as delay/Doppler (D/D) altimetry. One of the main benefits of delay/Doppler (D/D) altimetry is the improved resolution of the system along the satellite track. By means of an unfocused Synthetic Aperture Radar (SAR) processing technique, the altimeter footprint along the flight direction can be reduced by an order of magnitude with respect to conventional altimeters, i.e. around 300 meters. However, we are pushing even further the limits of this technology, as we have developed a processing technique that could improve the along-track resolution down to the meter level.
By accounting for the phase evolution of the targets in the scene, it is possible to counter-rotate the phase of the FBR I/Q complex echoes along the aperture, and perform inter-burst coherent averaging potentially as long as the target illumination time. This process, similar to SAR imaging systems, reduces the along-track resolution down to the theoretical limit equal to L/2, where L is the antenna length. We call this the fully focused SAR Altimetry processing. For the development of the technique we have used the CryoSat-2 SAR Mode data, but our methods could also be used with similar data from Sentinel-3 or Sentinel-6/Jason-CS.
The footprint of a fully focused SAR altimeter measurement is an elongated strip on the surface, which is pulse-limited across-track and SAR focused along-track. The technique has been demonstrated using transponder data, showing an achievable along-track resolution of 0.5 meters. Despite the asymmetry of the altimeter footprint, the fully focused technique may be useful for applications in which one needs to separate specific targets within highly heterogeneous scenes, such as in the case of sea-ice leads detection, hydrology, and coastal altimetry applications. Applying this technique on CryoSat-2 data over land and sea-ice, we can correctly measure the along-track extent of water bodies and ice-leads only a few meters long in the along-track dimension.
Over the open ocean, the fully-focused SAR technique can also provide significant improvements with respect to the other radar altimeter techniques. Fig. 1(a) shows the sea level anomaly (SLA), significant wave height (SWH) and radar cross section (RCS) obtained with the delay-Doppler processing (in grey), and with the fully-focused SAR technique. As can be observed, both estimates are mostly overlapping, showing that the fully-focused SAR technique can be used to obtain reliable estimations of ocean geophysical parameters. In addition, Fig.1 (b) shows the 1Hz noise estimations for these parameters for different processing approaches. The fully-focused SAR out-performs the delay/Doppler (unfocused SAR) processing technique by a factor of sqrt(2) in SLA and SWH, which could represent a significant improvement in a wide range of oceanographic applications
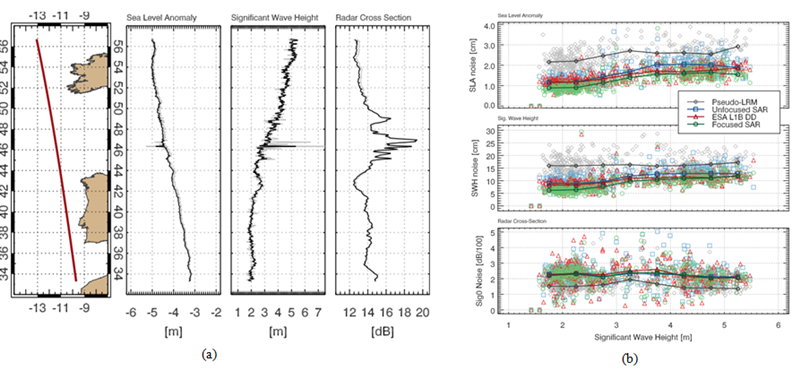
Figure 1: (a)CryoSat-2 SAR Mode track over the North-East Atlantic. The panels show the satellite track and the geophysical parameters retracking results for both PLRM (in gray) and fully-focused SAR data (in black) at 1 Hz. (b) Comparison of 1 Hz noise estimates for sea level anomaly, significant wave height, and radar cross section as a function of significant wave height, for the PLRM, unfocused SAR, and focused SAR processing approaches.
Accomplishments
Apart from the development of ocean applications, during this task we concentrated our effort in developing sea-ice applications. In this case, we compared CryoSat-2 observations to data from the Digital Mapping System (DMS) on board the IceBridge NASA mission. For this analysis, we selected a CryoSat-2 underflight performed on March 28, 2012. Within this track, we identified an area with recently formed sea ice leads. The FBR data of this track were processed by means of the FF-SAR processing technique, at an along-track resolution of 0.5 m. In order to compare our results directly to the official ESA products, we applied an along-track multilooking of 320 m, corresponding to a posting rate of roughly 20 Hz.
In Fig. 2(a), we show the power variations retrieved from the multilooked FF-SAR waveforms overlaid on the DMS geolocated and ortho-rectified images. For better visualization, the data were represented in polar-stereographic coordinates. The CryoSat and DMS data were acquired with a time difference under 1 h apart from each other; therefore, the ice drift is not significant for the type of analysis considered here. The along- track power variations are represented in color scale, setting in this case the 0-dB reference for the power measure from an extended ice surface (between 13 and 2 km south from the center of the image). After multilooking, the FF-SAR altimeter footprint is considered as a rectangle of 320 (along-track) × 1500 m (across-track), corresponding to the first waveform range gate projected on the ground. As observed from the image, as well as for the irrigation pond, the different features in the surface are clearly detected by the measured power variations, with a dynamic range of more than 30 dB.
In this application example, we also estimated the sea surface height (SSH) from the FF-SAR multilooked waveforms retrieved over sea ice leads. The sea ice lead positions were determined according to a surface classification method which is based on the pulse peakiness, and the delay/ Doppler stack standard deviation. These two parameters were retrieved from the ESA L2 and L1 b products. For the estimation of SSH over leads, we implemented a simple waveform peak power parabolic retracker; as sea ice leads act, mostly, as specular scatterers, it suffices to determine accurately the position of the waveform peak in order to obtain a precise estimation of the range to the surface. In order to compare the FF-SAR and ESA L2 measurements, we removed the geoid variations and a constant bias between both data sets. Therefore, for the span of the observation area considered here, the mean sea surface is centered on 0.
The results are shown in Fig. 6(b). The sea ice lead positions are highlighted in light blue in the figure, corresponding very accurately to the sea ice leads observed in the DMS images. The individual SSH measurements in leads are shown for both the FF-SAR and ESA L2 products, as well as the mean SSH in the lead as determined by each measurement method, along with the 1σ uncertainty in the mean. The latter are computed as the standard deviation of the SSH measurements divided by the square root of the number of available measurements within each lead, which is, in all the cases, the same for both FF-SAR and ESA L2. It should be noted that the associated errors for the FF-SAR measurements are consistently lower than those for the ESA L2 product. In addition, the standard deviation of the SSH measurements for the whole observation area considered here is reduced by a factor of sqrt(2), from 4.4 cm, for the ESA L2 product, to 3 cm for the FF-SAR estimations. This improvement in the SSH retrieval is related to an increase in the effective number of looks of the surface.
Planned work
Despite the demonstrated resolution and performance improvement, the development of applications for this novel technique still remains to be done, and considerable theoretical and empirical research is needed in order to optimize the exploitation of this new measurement technology. The planned work will focus on the development of applications for two-key areas for NOAA, namely the open and polar oceans, specifically sea surface height and sea ice applications.
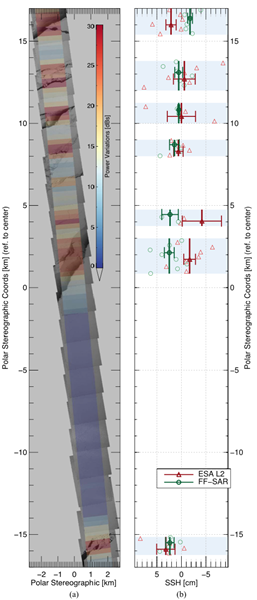
Figure 2. (a) Sigma-0 measurements from CryoSat-2 FF-SAR data, processed at full resolution, with an along-track multilooking of 30 m. The sigma-0 measurements, represented in color scale, are overimposed to NASA IceBridge DMS geolocated images. (b) Comparison of ESA L2 (dark red) product and FF-SAR (dark green) SSH estimations over sea ice leads. The sea ice lead positions are highlighted in light blue. The single ESA L2 and FF-SAR measurements are represented with triangles and circles, respectively. The solid lines with the associated error bars correspond to the mean and the uncertainty of the height measurements for each sea ice lead identified in the scene.
1) Sea Surface Height Applications
· Select an extended dataset in SAR mode with sufficiently diverse surface conditions to perform a statistically significant analysis of the performance of the FF-SAR technique vs other conventional altimetry methods.
· Process data in FF-SAR and delay/Doppler mode to determine waveform-to-waveform correlation in different sea state conditions.
· Develop a mode for waveform correlation as a function of sea state and coherent integration.
· Determine an optimum averaging strategy (coherent vs incoherent) of SAR altimeter radar returns.
2) Sea Ice Applications
· Determine best processing strategy in terms of final signal-to-noise ratio for D/D and FF-SAR mode observations over the open ocean. The parameters to be considered comprise: Hamming windowing (along-track and across-track), antenna pattern compensation, time dilation correction, etc…
Publications
(1) A. Egido, W. H. F. Smith, “Fully Focused SAR Altimetry: Theory and Applications”, IEEE Transactions on Geoscience and Remote Sensing, Jan. 2017
Products
· Sea Surface Height experimental product.
· Sea-ice freeboard experimental product.
Presentations
(1) Oral Presentations:
(a) A. Egido, W. Smith, “Fully-focused SAR Altimetry: Theory and Applications”, ESA Living Planet Symposium, Prague, Czech Republic, May 9-13, 2016
(b) W. Smith, A. Egido, “Fully focused coherent radar altimetry: precise datation, antenna motion, and transponder calibration”, ESA Living Planet Symposium, Prague, Czech Republic, May 9-13, 2016
(c) A. Egido, W. Smith, “Scientific Applications of Fully-Focused SAR Altimetry”, SAR Altimetry Workshop; La Rochelle, France, 31st Oct. 2016.
(d) W. Smith, A. Egido, “Some surprisingly wonderful aspects of fully focused SAR (FF-SAR) altimetry”, SAR Altimetry Workshop; La Rochelle, France, 31st Oct. 2016
(e) A. Egido, W. Smith, “Focused SAR Altimetry for Oceanographic Applications”, Ocean Surface Topography Science Team Meeting, La Rochelle, France, 1st – 4th Nov. 2016
(f) A. Egido, W. Smith, “Scientific Applications of Fully-Focused SAR Altimetry”, CICS-MD Science Meeting, College Park, MD, USA; Nov 29-30 and Dec 1, 2016
(g) A. Egido, W. Smith, “Sea-Ice Applications of Fully-focused SAR Altimetry”, North-American CryoSat Science Meeting 20-24 March 2017. Banff, Alberta, Canada.
Other
2016 NOAA Center for Satellite Applications and Research (STAR) Innovation Awardfor the development of Fully Focused SAR Altimetry. Awarded on 23rd June 2016 to Dr. Alejandro Egido and Dr. Walter H.F. Smith, by STAR director Mike Kalb, and NOAA/NESDIS Director Dr. Stephen Volz.