Performance Evaluation of OMPS
March 28, 2014 09:53 AM
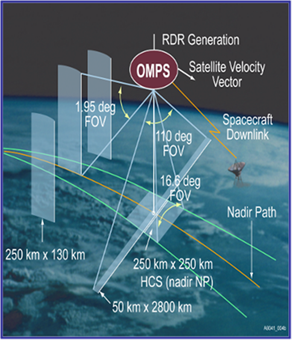
Figure 1: OMPS Earth view configuration.
© NOAA
C. Pan, CICS-MD, ESSIC, University of Maryland
X. Wu, NOAA/STAR
The Ozone Mapping Profiler Suite (OMPS) is one in a series of ozone monitoring sensors flown by NOAA and NASA. It continues more than 30 years of global ozone monitoring by providing data products of ozone in the Earth’s atmosphere. The OMPS Nadir system comprises two instruments: a Nadir Mapper (NM) and a Nadir Profiler (NP). The system has a common telescope with two grating spectrometers that provide a spectral sampling of 0.4 and 1 nm full-width half-maximum (FWHM) spectral resolution.
The NP covers the wavelength range from 250 to 310 nm using 146 spectral channels and the NM covers 300–380 nm using 196 spectral channels. In Earth observation mode, the OMPS cross-track NP and the NM fields of views (FOVs) are co-bore sighted to 0.1 (3-sigma level), where the NP has a 16.7 cross-track FOV providing ozone profiles in a single ground swath of 250 x 250 km at nadir, while the NM has a 110 cross-track FOV, providing ozone total column measurements in 35 ground cells across a 2800-km Earth view swath with a spatial resolution of 50 x 50 km at nadir. The Ozone Mapping Profiler Suite (OMPS) was launched aboard the Suomi National Polar-orbiting Partnership spacecraft on October 28, 2011. A successful thorough Early Orbit Checkout (EOC) and the Intensive Calibration and Validation enable current final validation stage. We have developed comprehensive data analysis algorithms to evaluate sensor performance and validate on-orbit calibration. End-to-end data analysis have performed to evaluate sensor critical parameters, detector dark current, system linearity, optical degradation, stray light contamination and wavelength registration. The critical sensor anomalies that have been identified are: a dichroic shift occurred when sensor was transitioned from ground to orbit; the cross-track position variation is wavelength dependent, and the stray light contamination causes ~2% errors in earth radiance retrieval.
Wavelength shift from ground to orbit
Figure 2 verifies there is wavelength shift from ground to orbit by showing the comparison result of the solar irradiance based on the same orbital wavelength table.
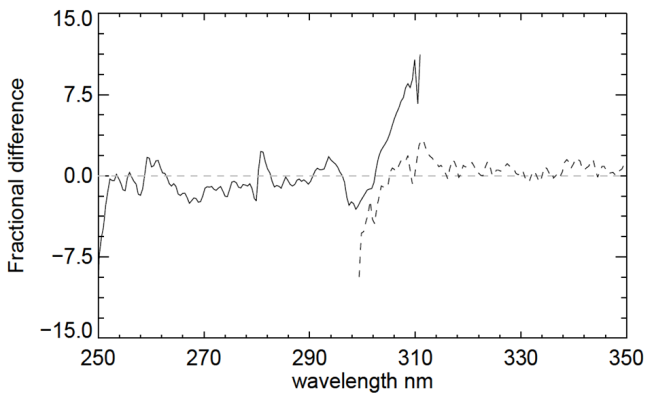
Figure 2 12% percent difference between observed solar flux and the predicted solar flux based on the orbital wavelengths occurred in spectral range 300-310 nm.
The predicted synthetic solar flux is computed by convolving the band center with the prelaunch defined slit function and a high resolution solar reference flux. A noticeable discrepancy of up to 12% observed in the NP and NM spectral overlap region 300-310 nm significantly higher than elsewhere indicates a dichroic shift of 0.15 nm occurred when sensor transitioned from ground to orbit.
Cross-track position variation
OMPS NM sensor exhibits wavelength dependent difference in the cross-track position. Such a feature presents in both the observed solar flux and the earth radiance. Figure 3 compares solar flux of the measured to the predicted synthetic data for 2 different cross-track positions relative to the nadir view position 17. The predicted synthetic data is computed by computed by convolving the band center with the prelaunch defined slit function and a high resolution solar reference flux. The difference reach a maximum 0f 2.5% at the two edge position on the NM CCD.
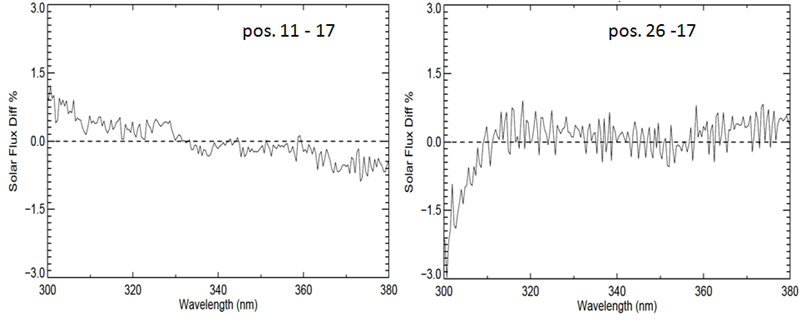
Figure 3 Cross-track position flux ratio difference for position 11 and 26 relative to nadir view of position 17, which introduces noticeable error of 2.5% in the radiance retrieval.
Orbital wavelength variation
Wavelength shifts in flight, specifically those of the OMPS TC sensor, do not change monotonically with time. In particular, temperature cycles in the sensor result in shifts in spectral registration on the focal plane. One of the critical calibration factors is the wavelength variation in the earth view products that is unable to be captured by the regular solar calibration. The compensation of this wavelength variation will improve radiance retrieval up to 0.1- 1% and the result suggests a compensation for the wavelength variation is necessary. Figure 4 shows OMPS Nadir observed annual cycle in Spectral Registration.
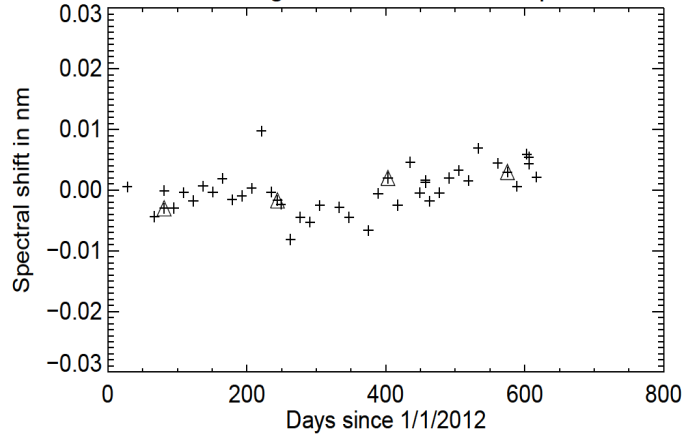
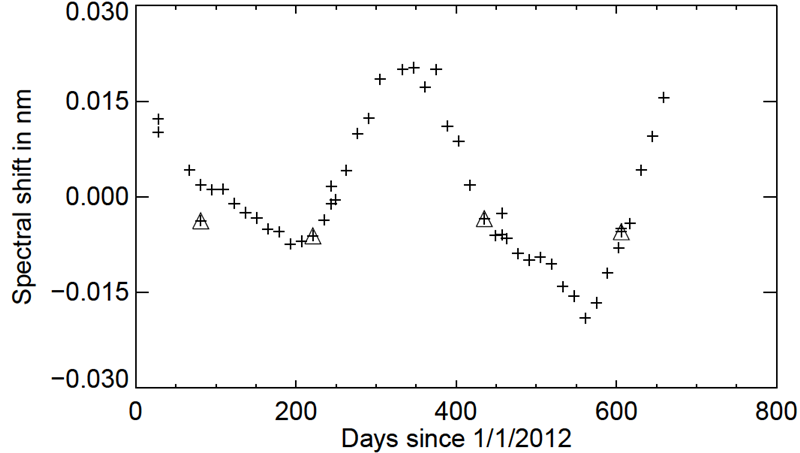
Figure 4 Observed annual cycle in Spectral Registration.
Sensor optic degradation
Figure 5 shows examples of time dependent sensor throughput change for 8 different wavelength channels, which are representative cases for all other channels. The degradation is estimated using a linear fitting between the change of the throughput and mission time. Data in the fitting is selected to remove any annul and seasonal variation. Our monitoring is to provide corrections for optics change, once the change exceeds a threshold that is to be determined based upon the resulting ozone error.
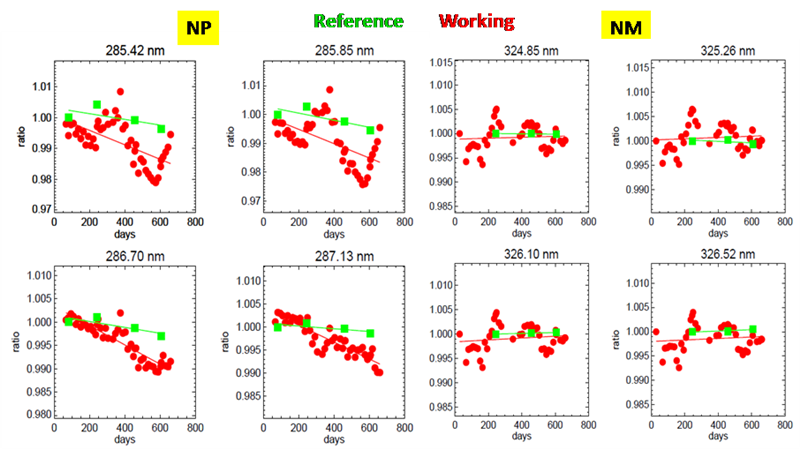
Figure 5 time dependent sensor throughput change for 8 different wavelength channels.
Inter-sensor comparison for stray light evaluation
To compare time-matching NP and NM radiances before and after stray light correction, we compared the earth radiance data in the wavelength overlap region between the NP and NM. Fig. 6 shows results from 306.5 nm, where according to lab calibration; both sensors’ sensitivities are high for producing good SNRs from both sensors.
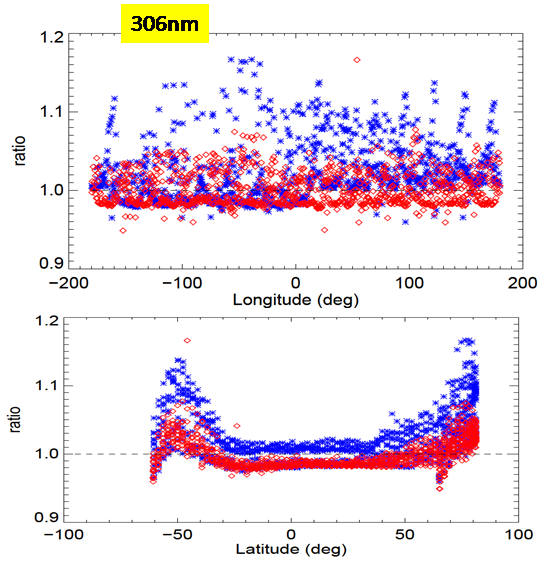
Figure 6 Geo-location dependent radiance ratio before (blue) and after (red) stray light correctionat 306 nm.
We linearly interpolated the NP radiances to the NM wavelength scale and matched each individual NP swath with 5 overlapping NM granule swaths, omitting comparisons and swaths that had any bad quality flags in an SDR, and binning 5 NM central cells into the same spatial region as the single NP FOV spatial cell. We computed radiance differences from wavelength-averaged means, as well as wavelength by wavelength (spectral) mean differences in the NP and NM radiances. The stray light correction shows a perspective improvement.
REFERENCES
J. V. Rodriguez, C. J. Seftor, C. G. Wellemeyer and K. Chance, “An Overview of the Nadir Sensor and Algorithms for the NPOESS Ozone Mapping and Profiler Suite (OMPS)”, Proc. SPIE 4891, Optical Remote Sensing of the Atmosphere and Clouds III, 65 (April 9, 2003); doi:10.1117/12.467525.
M. Chrisp, J. V. Rodriguez, A. L. Sparks, N. H. Zaun, P. Hendershot, T. Dixon, R. H. Philbrick and D. Wasinger, “Nadir Ultraviolet Imaging Spectrometer for the NPOESS Ozone Mapping and Profiler Suite (OMPS)”, Proc. SPIE 4814, Earth Observing Systems VII, 111 (September 25, 2002); doi:10.1117/12.453748.
C. Pan, M. Kowalewski, R. Buss, L. Flynn, X. Wu M. Capani and F. Weng, “Performance and Calibration of the Nadir Suomi-NPP Ozone Mapping Profiler Suite from Early-Orbit Image”, IEEE Journal of Selected Topics in Applied Earth Observations and Remote Sensing; DOI 10.1109/JSTARS.2013.2259144
NASA Goddard Space Flight Center, OMPS NADIR Total Column Ozone Algorithm Theoretical Basis Document, http://npp.gsfc.nasa.gov/science/sciencedocuments/ATBD_122011/474-00029_Rev-Baseline.pdf, April 22, 2011.
NASA Goddard Space Flight Center, “OMPS NADIR Profiler Algorithm Theoretical Basis Document”, http://npp.gsfc.nasa.gov/science/sciencedocuments/ATBD_122011/474-00026_Rev-Baseline.pdf, July 19, 2011.
NASA Goddard Space Flight Center, “Document for Ozone Mapping and Profiler Suite (OMPS) Total Column (TC) Sensor Data Records (SDR) Software”, http://npp.gsfc.nasa.gov/science/sciencedocuments/022012/474-00077_OAD-OMPS-TC-SDR-SW_RevA_20120127.pdf, January 25, 2012
NASA Goddard Space Flight Center, “Document for Ozone Mapping and Profiler Suite (OMPS) Nadir Profiler (NP) Sensor Data Records (SDR) Software”, http://npp.gsfc.nasa.gov/science/sciencedocuments/022012/474-00081_OAD-OMPS-NP-SDR-SW_RevA_20120127.pdf, January 25, 2012
M. Kowalewski, C. Pan and S. Janz, “Early orbit operations performance of the Suomi NPP OMPS instrument”, Proc. SPIE 8510, Earth Observing Systems XVII, 851007 (October 15, 2012); doi:10.1117/12.929753
« Back