cicsmd


Satellite Drought and Soil Moisture Prediction

August 20, 2013 01:23 PM
ESI
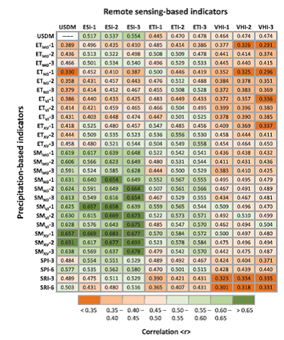
The 12-year average temporal correlation between remote-sensing and precipitation-based drought indicators [Acronyms: USDM (U.S. Drought Monitor), ETI (Evapotranspiration Index), VHI (Vegetation Health
© Anderson et al. (2013), Fig.6.

Christopher Hain is the Task Leader on several CICS-MD tasks involving the use of thermal-infrared (TIR) data from GOES and vegetation information from MODIS in the ALEXI model to calculate daily maps of the Evaporative Stress Index (ESI). He just had an article published last month and three more this month:

  • Vikalp Mishra, James F. Cruise, John R. Mecikalski, Christopher R. Hain, and Martha C. Anderson, 2013: A Remote-Sensing Driven Tool for Estimating Crop Stress and Yields, Remote Sens., 5, 3331-3356; doi:10.3390/rs5073331.
  • Martha C. Anderson, Christopher Hain, Jason Otkin, Xiwu Zhan, Kingtse Mo, Mark Svoboda, Brian Wardlow, and Agustin Pimstein, 2013: An Intercomparison of Drought Indicators Based on Thermal Remote Sensing and NLDAS-2 Simulations with U.S. Drought Monitor Classifications, J. Hydrometeor., 14, 1035-1056.
  • Jason Otkin,Martha C. Anderson, Christopher Hain, Iliana E. Mladenova, Jeffrey B. Basara, and Mark Svoboda, Examining Rapid Onset Drought Development Using the Thermal Infrared–Based Evaporative Stress Index, J. Hydrometeor., 14, 1057-1074.
  • R. M. Parinussa, M. T. Yilmaz, M. C. Anderson, C. R. Hain and R. A. M. de Jeu, 2013: An intercomparison of remotely sensed soil moisture products at various spatial scales over the Iberian Peninsula, Hydrol. Process., DOI: 10.1002/hyp.9975 (Aug 14).

(Christopher Hain, chris.hain@noaa.gov, 301-683-3577).


« Back

 
close (X)