Aircraft Aerosol Observations for Satellite Evaluation
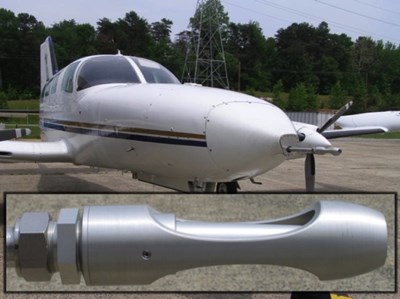
Cessna 402B with aerosol inlet
©
Xinrong Ren, Jeff Stehr, and Russ Dickerson
The composition of the atmosphere (trace gases and aerosols) has a profound effect on human health, visibility, and the Earth’s radiative properties. Aerosol optical depth (AOD) observed from satellites can provide a view broad in space and time, but the accuracy of retrievals for varying surface properties, and varying aerosol optical properties, as well as the relationship between remotely sensed AOD and surface concentration of PM2.5 (in mass per unit volume, called suspended matter in GOES-R F&PS requirements document) remain as major unanswered questions in atmospheric science [EPA, 2009]. Reliable PM2.5 retrievals can fill in missing surface measurements in areas with sparse ground monitoring coverage and be used for evaluating air quality models and as exposure metrics in epidemiological studies [Sorek-Hameret al., 2013].
A number of studies [e.g., Hoff and Christopher, 2009; Chudnovskyet et al., 2013; Lee et al., 2011] have made progress on the links between AOD from satellite and PM2.5 at the ground. The most problematic issue is that the correspondence between AOD and PM2.5 is at times excellent, while at others it is poor, and always it is variable. Among the most successful attempts was a study by Kloog et al. [2011] that employed a mixed effects model, which allowed the relationships between PM2.5 concentrations and AOD from satellite to vary daily, incorporating nine different parameters, including emissions inventories.
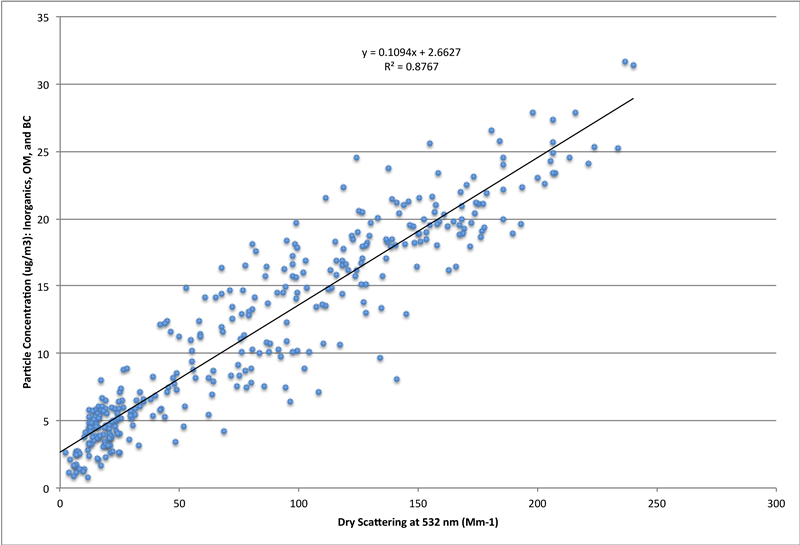
Figure 1.Correlation between particle mass concentrations integrated from detailed speciation of PM2.5 and dry scattering measured during DISCOVER-AQ in 2011.
Initial results from the DISCOVER-AQ study in 2011 show that profiles of scattering are well correlated with PM2.5 mass when the measurements are closely co-located in space and time (Figure 1). Climatological profiles of scattering show that it is generally well-mixed, and that the surface scattering is closely related to that in the rest of the column. We continue to examine the relationship between AOD from the aircraft and surface PM2.5 from the network of fast PM2.5 monitors deployed by Maryland Department of the Environment (MDE) so that we will be able to tie AOD from satellite to PM2.5 at the surface.
We fly the aircraft over representative land surfaces under different meteorological and air quality conditions to evaluate, test, and improve satellite retrievals. Aircraft profiles of trace gases and aerosol optical properties can help evaluate remote sensing observations. The monitors can in turn provide useful evaluation for chemical transport models (CTM), and satellite observations will ultimately be combined with CTM output for more accurate determination of near surface PM2.5 [Kondragunta et al., 2008].
The instrument package, summarized in Table 1, has been used successfully for more than ten years [He et al., 2014; Brent et al., 2013; Stauffer et al., 2012; Castellanos et al., 2011; Hains et al., 2008; Hains, 2007; Taubman et al., 2006; Marufu et al., 2004; Taubman et al., 2004a; Taubman et al., 2004b]
Table 1. UMD Aircraft Instrumentation
|
Variable
|
Method
|
|
Position
|
GPS
|
|
Meteorology (T, RH, P)
|
Thermistor Hygristor, Capacitance Manometer
|
|
Ozone (O3)
|
UV Absorption
|
|
Sulfur Dioxide (SO2)
|
Pulsed Fluorescence
|
|
Carbon Monoxide (CO)
|
NDIR
|
|
Nitrogen Dioxide (NO2)
|
Cavity Ringdown
|
|
Aerosol Scattering, bscat (450, 550, 700 nm)
|
Nephelometer
|
|
Aerosol Absorption, babs (380, 470(450), 520(550), 590, 660, 880, 950 nm)
|
Aethalometer
|
|
Particle numbers (6 cuts – Range 0.3-1.0 µm)
|
Optical Particle Counter
|
|
Particle number density
|
Condensation Particle Counter
|
|
Aerosol Mass and Composition
|
Filter samples IC and LC/MS
|
Recent updates to the instrumentation include an isokinetic inlet, a bulk aerosol filter sampler, and a 7-wavelength Aethalometer (Figure 2). Brent et al. (2013) and Brent et al. (2014) describe the sampling and analytical techniques for PM mass, ions, and specific organic acids.
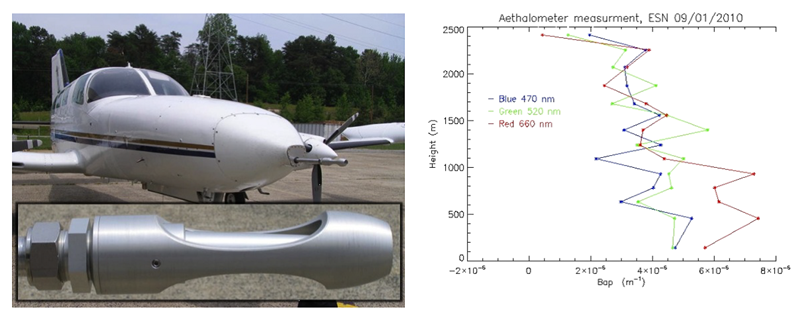
Figure 2. Left, Cessna 402B with aerosol inlet that has a 50% passing efficiency for 5 µm particles [Huebert et al., 2004; McNaughton et al., 2007]. Right, results of a test flight showing absorption coefficient as a function of altitude over Easton, MD; for clarity only three wavelengths are shown.
Flight plans for the Mid-Atlantic region include profiles from near the surface to approximately 3500 m altitude over cropland in the Eastern Shore. One location is Massey Aerodrome in Millington, MD, where MDE has continuous fast PM2.5 measurement. Flights are coordinated with instant GOES EAST Aerosol/Smoke Product (GASP) images and VIIRS (Suomi NPP) orbit tracks over the northeast US. When possible, we will fly profiles over pairs of sites, one upwind and one downwind of the urban area. Another site for this gradient measurement is the MDE’s Fairhill site in Elkton, MD, which is located ~30 miles to the north of the Millington site, and the Horn Point site in Cambridge, MD, which is located ~50 miles to south/southwest of the Millington site. Flights are planned on days under representative synoptic conditions conducive to remote sensing – generally cloud-free. For example, in the summer this includes subsidence conditions under the Bermuda High; or in the winter skies are generally clear behind a cold front.
To evaluate satellite retrievals, we analyze and interpret data collected on flights to compare observed AOD to GOES-R/VIIRS proxy and other products and to surface observations of PM2.5 using the vertical profiles of aerosol optical properties observed from aircraft. A uniform profile of aerosol scattering coefficient does not guarantee uniformly distributed PM2.5 in the PBL as aerosol extinction is a function of RH and SND.
The aircraft data collected is used to validate the GOES-R ABI aerosol products using the approach shown in Figure 3. Aircraft profiles of aerosol extinction are ideally be matched with GOES-R ABI AOD within a window of five to fifteen minutes to obtain a clear view (a composite can be created using multiple snapshots of ABI) co-located with aircraft profile and integrated to compare AODs. The example profile shown in Figure 3 uses GOES-12 AODs (a composite over 3-hr temporal window to obtain clear views) with an aircraft aerosol extinction profile overlaid. The aircraft extinction profile is integrated to obtain AOD and compared to GOES AODs and ABI AOD/suspended matter generated using MODIS radiances as proxy for ABI.
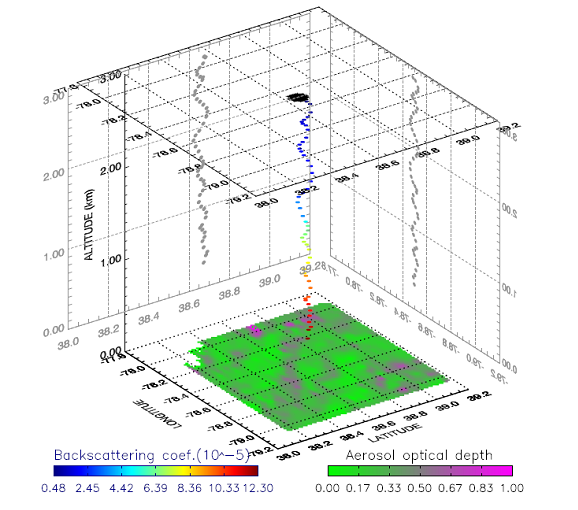
Figure 3. Sample aircraft profile of aerosol extinction obtained by UMD aircraft measurements on June 9, 2010 superimposed on the 2D Field of GOES AOD (the GOES AOD composite was created for a 3-hr time hour window around the aircraft profile measurement time).
Finally, the observations are used to refine and improve CTM’s such as CMAQ and CAMx. These models can provide the additional information necessary to infer surface aerosol mass concentration from remotely observed AOD. The results are also used by MDE in the context of air quality planning for the Maryland State Implementation Plan.
Remote sensing of aerosol optical properties, and especially aerosol concentrations near Earth’s surface (PM2.5), remains both a great scientific and technical challenge. Our goal is to develop techniques for relating remotely sensed AOD and its link to surface PM2.5. We can then apply a more physically based approach to evaluate emissions inventories and forecast PM2.5.
References:
Brent, L. C., W. J. Thorn, M. Gupta, B. Leen, J. W. Stehr, H. He, H. L. Arkinson, A. Weinheimer, C. Garland, S. E. Pusede, P. J. Wooldridge, R. C. Cohen, R. R. Dickerson, Evaluation of the use of a commercially available cavity ringdown absorption spectrometer for measuring NO2 in flight, and observations over the Mid-Atlantic States, during DISCOVER-AQ, J. Atmos. Chem., doi 10.1007/s10874-013-9265-6, 2013.
Brent, L. C., J. L. Reiner, L. C. Sander, and R. R. Dickerson A method for characterization of low molecular weight organic acids in atmospheric aerosols using ICMS, Anal. Chem., submitted, 2013.
Castellanos, P., L. T. Marufu, B. G. Doddridge, B. F. Taubman, S. H. Ehrman, and R. R. Dickerson, Ozone, nitrogen oxides, and carbon monoxide during pollution events over the eastern US: An evaluation of emissions and vertical mixing, J. Geophys. Res., 116, D16307, doi:10.1029/2010JD014540, 2011.
Chudnovsky, A., C. Tang, A. Lyapustin, Y. Wang, J. Schwartz, and P. Koutrakis, A critical assessment of high-resolution aerosol optical depth retrievals for fine particulate matter predictions, Atmos. Chem. Phys., 13, 10,907–10,917, 2013.
Crippa, P., D. Spracklen, and S. C. Pryor (2013), Satellite-derived estimates of ultrafine particle concentrations over eastern North America, J. Geophys. Res., 118(17), 9968-9981.
EPA (2009), Integrated Science Assessment for Particulate Matter (Final Report), Washington, DC.
Hains, J. C., B. F. Taubman, A. M. Thompson, J. W. Stehr, L. T. Marufu, B. G. Doddridge, and R. R. Dickerson (2008), Origins of chemical pollution derived from Mid-Atlantic aircraft profiles using a clustering technique, Atmos. Environ., 42, 1727-1741.
Hains, J. C., L. W. A. Chen, B. F. Taubman, B. G. Doddridge, and R. R. Dickerson (2007), A side-by-side comparison of filter-based PM2.5 measurements at a suburban site: A closure study, Atmos. Environ., 41, 6167-6184.
He, H., C. P. Loughner, J. W. Stehr, H. L. Arkinson, L. C. Brent, M. B. Follette-Cook, M. A. Tzortziou, K. E. Pickering, A. M. Thompson, D. K. Martins, G. S. Diskin, B. E. Anderson, J. H. Crawford, A. J. Weinheimer, P. Lee, J. C. Hains, and R. R. Dickerson, An elevated reservoir of air pollutants over the Mid-Atlantic States during the 2011 DISCOVER-AQ campaign: Airborne measurements and numerical simulations, Atmos. Environ., 85, 18-30, 2014
Hoff, R. M. and S. A. Christopher, “Remote Sensing of Particulate Pollution from Space: Have We Reached the Promised Land?”, Journal of the Air & Waste Management Association, 59(6), 645-675, 2009.
Huebert, B., T. Bertram, J. Kline, S. Howell, D. Eatough, and B. Blomquist, Measurements of organic and elemental carbon in Asian outflow during ACE-Asia from the NSF/NCAR C-130, Journal of Geophysical Research-Atmospheres, 109, 2004.
Kloog, I., P. Koutrakisa, B. A. Coullb, H. J. Lee, J. Schwartz, “Assessing temporally and spatially resolved PM2.5 exposures for epidemiological studies using satellite aerosol optical depth measurements”, Atmos. Environ., 45, 6267-6275, 2011.
Lee, H. J., Y. Liu, B. A. Coull, J. Schwartz, and P. Koutrakis, A novel calibration approach of MODIS AOD data to predict PM2.5 concentrations, Atmos. Chem. Phys., 11, 7991–8002, 2011.
Kondragunta, S., P. Lee, J. Mcqueen, C. Kittaka, A. I. Prados, P. Ciren, I. Laszlo, R. B. Pierce, R. Hoff And J. J. Szykman, “Air Quality Forecast Verification Using Satellite Data”, J. Appl. Meteorol. Climatol., 47, 425-442, 2008.
McNaughton, C. S., A. D. Clarke, S. G. Howell, M. Pinkerton, B. Anderson, L. Thornhill, C. Hudgins, E. Winstead, J. E. Dibb, E. Scheuer, and H. Maring, Results from the DC-8 Inlet Characterization Experiment (DICE): Airborne versus surface sampling of mineral dust and sea salt aerosols, Aerosol Science and Technology, 41, 136-159, 2007.
Prados, A. I., S. Kondragunta, P. Ciren, and K. R. Knapp, “GOES Aerosol/Smoke Product (GASP) over North America: Comparisons to AERONET and MODIS observations”, J. Geophys. Res., 112, D15201, doi:10.1029/2006JD007968, 2007
Sorek-Hamer, M., A.W. Strawa, R.B. Chatfield, R. Esswein, A. Cohen, D.M. Broday, Improved retrieval of PM2.5 from satellite data products using non-linear methods, Environ. Pollut., 182, 417-423, doi: 10.1016/j.envpol.2013.08.002, 2013.
Stauffer, R. M., A. M. Thompson, J. W. Stehr, D. Goldberg, R. R. Dickerson Bay Breeze Influence on Surface Ozone at Edgewood, MD During July 2011, ,et al., J. Atmos. Chem.., doi: 10.1007/s10874-012-9241-6, 2012
Taubman, B. F., J. C. Hains, L. T. Marufu, B. G. Doddridge, A. M. Thompson, J. W. Stehr, C.A. Piety, R.R. Dickerson, Aircraft Vertical Profiles of Trace Gas and Aerosol Pollution over the Mid-Atlantic U.S.: Statistics and Meteorological Cluster Analysis, J. Geophys. Res., 111(D10), D10S07, 10.1029/2005JD006196, 2006. file.pdf
Taubman, B. F., L. T. Marufu, C. A. Piety, B. G. Doddridge, J. W. Stehr, and R. R. Dickerson, Airborne characterization of the chemical, optical, and meteorological properties, and origins of a combined ozone-haze episode over the eastern United States, J. Atmos. Sci., 61, 1781-1793, 2004a.
Taubman, B. F., L. T. Marufu, B. L. Vant-Hull, C. A. Piety, B. G. Doddridge, R. R. Dickerson, and Z. Q. Li, Smoke over haze: Aircraft observations of chemical and optical properties and the effects on heating rates and stability, Journal of Geophysical Research-Atmospheres, 109, 2004b.
« Back