SFR Captures Early Season Snowstorm
October 29, 2020 09:00 AM
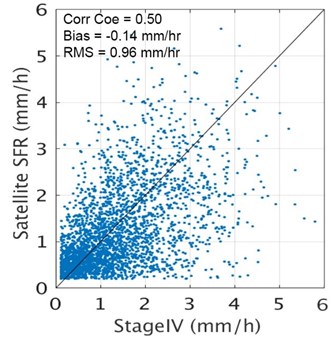
Figure 2: Scatter plot of SFR vs. Stage IV from the snowfall event on September 8-9.
© NOAA
The NOAA Snowfall Rate Product, developed by Huan Meng, Jun Dong, Cezar Kongoli, and Ralph Ferraro, performed well when several western states experienced one of the earliest snowstorms on September 8-9. An Arctic front brought significant snowfall to the area following a period of record setting high temperatures. For instance, Denver had a 61-degree temperature drop, from 93 ˚F to 32 ˚F in less than 24 hours. The microwave SFR product captured the snowstorm as it traveled from Montana to Colorado and into New Mexico. Figure 1 presents two of the SFR images respectively from NOAA-20 and S-NPP. Also shown are the corresponding National Operational Hydrologic Remote Sensing Center (NOHRSC) modeled hourly snowfall, and the Stage IV radar and gauge combined hourly precipitation (including both rain and snow).
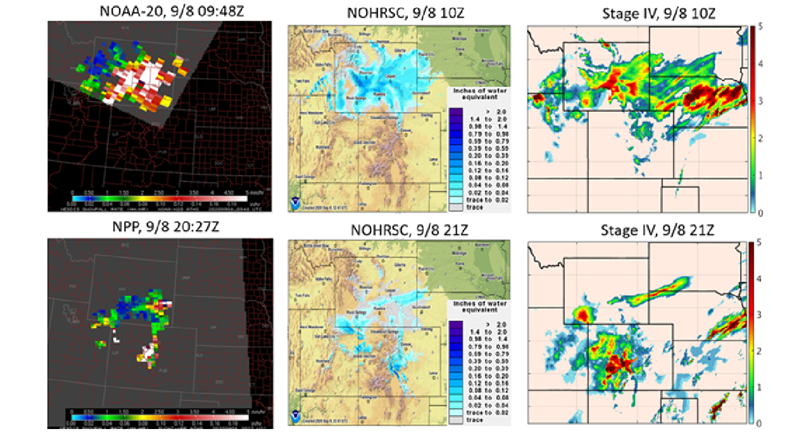
Figure 1. Top: NOAA-20 SFR at 9:48Z on September 8 (left), the corresponding NOHRSC hourly snow precipitation (center) and the Stage IV hourly precipitation (including both rain and snow) (right). Bottom: Same as the top but for S-NPP at 20:27Z on September 8. The SFR images are courtesy of NASA SPoRT.
Figure 2 is the SFR vs. Stage IV scatter plot produced from about 25 overpasses from five satellites including NOAA-20 and S-NPP. The performance statistics are shown in the scatter plot at the top of the page. For an early season event, the SFR product performed reasonably well with a correlation coefficient of 0.5 with Stage IV. The link below is an animation of the SFR images from this snowfall event (courtesy of Jorel Torres from CIRA): http://cics.umd.edu/~hmeng/SFR/nesdis-snowfall-rate-animation.gif
« Back