Fire Emissions for GBBEPx Increased by Adding Sentinel-3 Data
June 26, 2026 01:00 PM
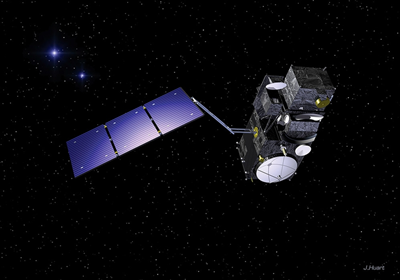
Figure 1: The European Space Agency’s Sentinel 3 satellite
© ESA
by Debra Baker
CISESS Consortium Scientist Xiaoyang Zhang has worked to develop and improve the NOAA Global Biomass Burning Emissions Product eXtended (GBBEPx) since its inception (Zhang, X., et al., 2012). He is a Distingished Professor at South Dakota State University and the Director of its Geospatial Science Center of Excellence. On his current CISESS Project, he has been joined by Assistant Research Professor Fangjun Li, Research Associate Yongchang Ye, and PhD Student Ruixuan Li. They have been evaluating the usefulness of adding Sentinel-3 data (see Figure 1) to this product under their most recent CISESS project.
The GBBEPx V3 product provides daily global biomass burning emissions, which include:
-
Particulate Matter less than 2.5 microns in diameter (PM2.5);
-
Black Carbon (BC);
-
Carbon Monoxide (CO);
-
Carbon Dioxide (CO2);
-
Ammonia (NH3);
-
Organic Carbon (OC); and
-
Sulfur Dioxide (SO2).
Concentrations are on 0.1⁰ x 0.1⁰ and 25 km x 25 km FV3 C384 grids, which are compatible with the new NOAA Unified Forecast System and other systems. This information is from Visible/Infrared Imager Radiometer Suite (VIIRS) instruments on the NOAA-20 and NOAA-21 satellites. A recent CO2 map is shown in Figure 2.
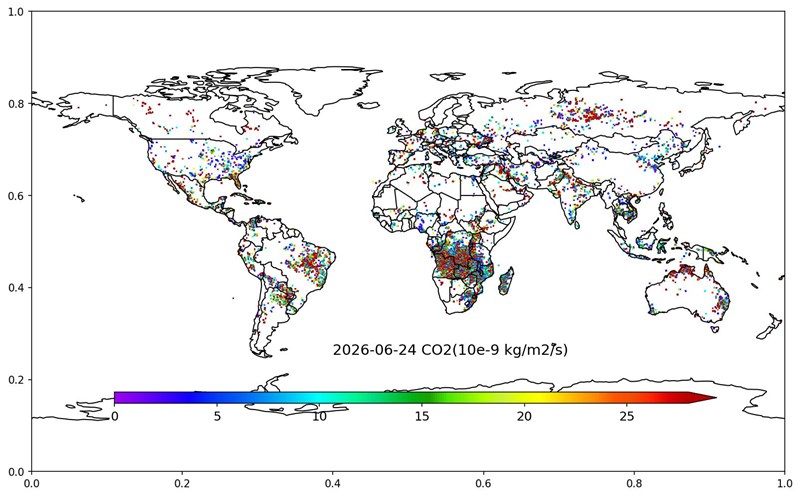
Figure 2: The GBBEPx map of carbon dioxide emissions for 24 June 2026. From: https://www.ospo.noaa.gov/products/land/gbbepx/
The near-real-time operational product is available from OSPO and archived GBBEPx is available from NCEI.
Having accurate and up-to-date information on biomass burning emissions is necessary because of their negative effects on human health, ecosystems, air quality, and climate. This data is also critical to atmospheric modeling, especially for air quality (Parrington et al., 2025). Daily GBBEPx emissions are currently used by the NOAA National Weather Service in its operational global aerosol model (Zhang, L., et al., 2022).
The GBBEPx currently estimates fire emissions from VIIRS only, which could miss the fires occurring in the mid-morning and late evening. For the last year, Xiaoyang Zhang’s CISESS project was focused on whether fire emissions estimation could be improved by including fire detections from Sentinel-3 satellites (local overpass time roughly 10:00am). The Sentinel-3A & B satellites are European Space Agency (ESA) satellites designed for ocean and global land monitoring services. The radiometer on these satellites is called the Sea and Land Surface Temperature Radiometer (SLSTR; see Figure 3).
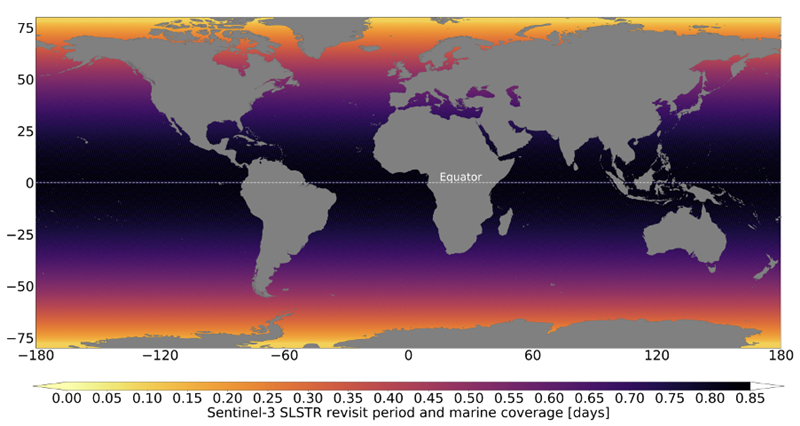
Figure 3: The overpass frequency in fractional days of the Sentinel 3 SLSTR data collection by latitude, from https://user.eumetsat.int/resources/user-guides/sentinel-3-slstr-level-1-data-guide.
This project evaluated the fire detections and Fire Radiative Power (FRP) retrievals from Sentinel-3 by comparing them with other satellite fire products. FRP quantifies the rate at which energy is radiated from a fire, expressed in megawatts (MW) or gigawatts (GW). It is related to the rate of biomass combustion and the rate of emissions, which are used to estimate trace gas and aerosol emissions (Li, F., et al., 2018).
The team collected global active fire and corresponding geolocation products for VIIRS I-band, Terra/ Moderate Resolution Imaging Spectroradiometer (MODIS), and Sentinel-3 (S3) from 2021 to 2025. The Quick Fire Emissions Dataset (QFED 2.6) in 2021 and 2025 was collected from NASA, which was used as a reference for calculating S3 FRP emissions coefficients.
The team conducted a complex analysis of cloud contamination in S3 FRP before choosing a method to calculate clear-sky areas and cloud areas. Another complication was the varying size of pixels in the instantaneous field of view. Once the fire vs. nonfire pixels were identified, the fire pixels were regridded to a consistent 0.05⁰ grid. An average pixel grid size in the S3 Thermal Infrared (TIR) L1b geolocation product was used for the nonfire pixels. Any double counting between the fire and nonfire grids due to the regridding process was checked and corrected.
The emission coefficients for the S3 FRP grids were calculated using the QFED. The FRP coefficient is biome-specific, so S3 FRP grids had to be categorized into four biomes:
-
Tropical Forests;
-
Extratropical Forests;
-
Cerrado/Woody Savanna; and
-
Grassland/Cropland.
Then the calculations were separated by continent: North America, South America, Asia, Europe, Africa, and Australia. These correlations yielded the emission coefficients for CO, CO2, OC, BC, PM2.5, SO2, NH3, methane (CH4), and nitric oxide (NO).
The GBBEPx computer code was then updated to process S3 fire observations. The code handles several S3 issues like broken files of active fires and cloud strips. The updated GBBEPx computer code was able to calculate daily global emissions from S3 fire observations (see Figure 4).
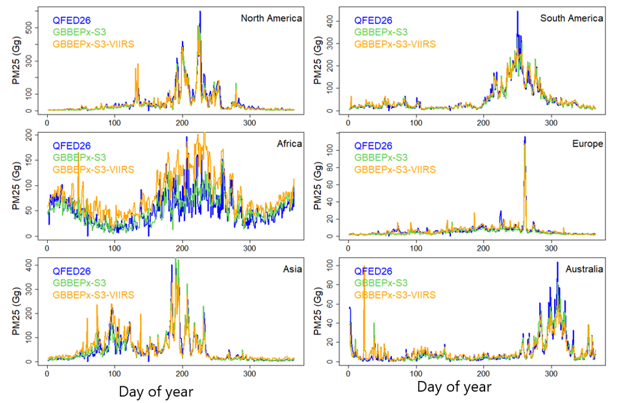
Figure 4. Daily fire emissions in 2024 estimated from S3 fire observations (green), integrated with VIIRS fire observations (orange), and further compared with QFED 26 (blue). Daily PM2.5 observations are shown for the six continents over an annual cycle. (from Xiaoyang Zhang, 2026 CISESS Annual Report and Slide.)
The results above show that blending S3 and VIIRS can significantly increase fire emissions estimates in Africa. This is due to the fact that fire occurrences during a day are very heterogeneous in Africa so that some fires are captured by VIIRS only while others by S3 only.
Zhang and his scientists then made the comparisons of S3 SFR with other satellite products. The Experimental Next Generation Fire System (NGFS) FPR, a product derived from the Advanced Baseline Imager (ABI) on GOES-18 & -19, was compared with S3 FRP for July-October 2025. The results were similar over this period, with a correlation coefficient of r2 > 0.65. The correlation did vary, with stronger correlation in the eastern United States compared to western CONUS. The relationship was also stronger in nighttime than in daytime.
More extensive testing was done with the MODIS on the Terra satellite. First, a grid-to-grid comparison (0.05⁰ x 0.05⁰) was done for 2025. The result shows that S3 detects more fires than Terra MODIS (see Figure 5), especially at night, although their overpass times are similar. This is likely associated with the two mid-infrared channels in S3 that are able to detect small and/or cool fires with low temperatures.
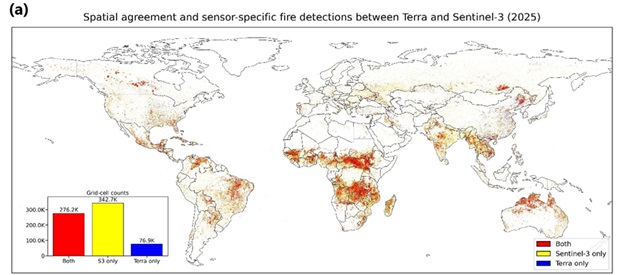
Figure 5: Comparison of fire detections between S3 and Terra MODIS in 2025 based on the fire spatial distribution on the 0.05° grid. (from Xiaoyang Zhang, 2026 CISESS Annual Report and Slide).
Their next MODIS comparison was based on spatially and temporally matched pixels in 2025. Matching was done based on three criteria:
-
time;
-
spatial distance; and
-
viewing zenith angle (VZA).
Three different classes of matching (strict, moderate, and loose) based on these factors, were then compared. The comparisons based on the samples from the three classes showed similar results, in which pixel-based S3 FRP from day and night together is slightly larger than Terra MODIS FRP. Looking specifically at the strict matching class, S3 FRP is distinctively larger during daytime but slightly smaller during nighttime than Terra MODIS data (see Figure 6).
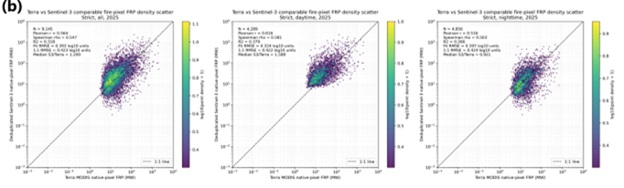
Figure 6: Comparison of fire detections between S3 and Terra MODIS FRP values in spatially and temporally strictly matched pixels: all day (left), daytime (middle), and nighttime (right). S3 is on the y-axis, and MODIS is on the x-axis. (from Xiaoyang Zhang, 2026 CISESS Annual Report and Slide.)
S3 FRP was next compared with MODIS FRP on a continental basis. They both had consistent temporal patterns and were highly correlated. However, there were larger differences in Asia and Australia. There were occasional extreme differences. On 23 January 2024, S3 detected many more fires than Terra MODIS. On 12 May 2024, Terra MODIS missed all the fires in South America. The possibility of false alarms in S3 still needs to be explored.
|
RESULTS
|
|
Ø Sentinel-3 detects more active fires than Terra MODIS does.
|
|
Ø Sentinel-3 FRP is slightly larger than Terra MODIS FRP for the matched fires, particularly in daytime.
|
|
Ø Sentinel-3 fire detections could enhance the fire emissions estimation from VIIRS alone, particularly in Africa.
|
Source: Xiaoyang Zhang, 2026 CISESS Annual Report and Slide
Other Sources*
Li, Fangjun, Xiaoyang Zhang, Shobha Kondragunta and Ivan Csiszar, 2018: Comparison of fire radiative power estimates from VIIRS and MODIS observations. J. Geophys. Res. Atmos., 123, 4545–4563, https://doi.org/10.1029/2017JD027823.
Parrington, Mark; Cynthia H. Whaley, Nancy H. F. French, Rebecca R. Buchholz, Xiaohua Pan, Christine Wiedinmyer, Edward J. Hyer, Shobha Kondragunta, Johannes W. Kaiser, Enza Di Tomaso, Guido R. van der Werf, Mikhail Sofiev, Kelley C. Barsanti, Arlindo M. da Silva, Anton S. Darmenov, Wenfu Tang, Debora Griffin, Maximilien Desservettaz, Therese (Tess) Carter, Clare Paton-Walsh, Tianjia Liu, Andreas Uppstu, Julia Palamarchuk, 2025: Biomass burning emission estimation in the MODIS era: State-of-the-art and future directions. Elementa: Sci. Anthropocene.,13(1), 00089, https://doi.org/10.1525/elementa.2024.00089.
Zhang, Li; Raffaele Montuoro, Stuart A. McKeen, Barry Baker, Partha S. Bhattacharjee, Georg A. Grell, Judy Henderson, Li Pan, Gregory J. Frost, Jeff McQueen, Rick Saylor, Haiqin Li, Ravan Ahmadov, Jun Wang, Ivanka Stajner, Shobha Kondragunta, Xiaoyang Zhang, and Fangjun Li, 2022: Development and evaluation of the Aerosol Forecast Member in the National Center for Environment Prediction (NCEP)'s Global Ensemble Forecast System (GEFS-Aerosols v1). Geosci. Model Dev., 15, 5337–5369, https://doi.org/10.5194/gmd-15-5337-2022.
Zhang, Xiaoyang; Shobha Kondragunta, Jessica Ram, Christopher Schmidt,and Ho-Chun Huang, 2012: Near-real-time global biomass burning emissions product from geostationary satellite constellation. J. Geophys. Res. Atmos., 117, D14201, https://doi.org/10.1029/2012JD017459.
*Bold-CISESS & Underline-NOAA
« Back