Wildfires Disrupt the Atmospheric Nitrogen Cycle in Ecosystems
April 3, 2026 10:16 AM
see Figure 1 below.
© GMU
By Maureen Cribb, CISESS Coordinator
Reactive nitrogen (Nr) includes all nitrogen compounds in the atmosphere and biosphere that are active in biological, chemical, or radiative processes, such as nitrogen oxides (NOx) and ammonia (NH3), among others. Thanks to environmental regulations and technological advances, air pollutants like NOx have generally decreased over the past decades. However, there is growing evidence that wildfires are contributing more and more to levels of detrimental Nr, especially in the northwest U.S. where wildfire seasons have become increasingly long and intense. A clearer understanding is needed of multi-decadal fire activity and how it influences changes in Nr emissions, deposition, and impacts on downwind ecosystems across the contiguous United States (CONUS).
CISESS Consortium Scientists Patrick Campbell, Daniel Tong, Youhua Tang (GMU) and coauthors aim to fill this gap in knowledge in their paper published in the journal Communications Earth & Environment. The authors applied the George Mason University North American chemical reanalysis system to carry out two sets of state-of-the-science 20-year (2002–2021) coupled weather-chemical transport model simulations, one “with-fire” impacts and the other “without-fire” impacts, to quantify the change in relative trends and contributions of fire sources to total Nr emissions and deposition trends over the CONUS.
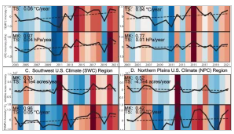
The warming stripes (graphics that use a series of colored stripes chronologically ordered to visually portray long-term temperature trends) and trends in wildfires and climate they found are shown in Figure 1.
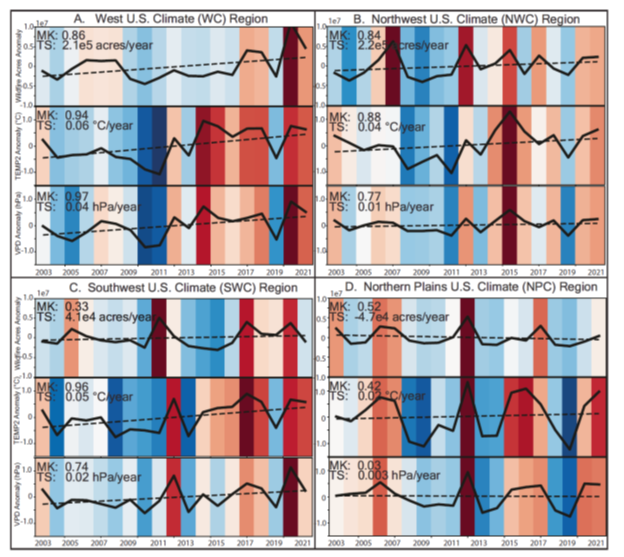
Figure 1: Warming stripes, annual values (solid lines), and trends (dashed lines) for annual 2002–2021in western U.S. fire climate regions. The stacked graphs for each region are
-
Total wildfires acres burned anomaly,
-
2-meter temperature (TEMP2) anomaly (degrees C), and
-
vapor pressure deficit (VPD) anomaly (hPa).
Cooler colors (including white to blues) indicate negative anomalies, while warmer colors (white to pinks and reds) indicate positive anomalies compared to the period average.
A major result is that there are increasing trends in the contribution of wildfires to higher Nr emissions, deposition, and critical load exceedances of up to 20–40% due to fires in the western U.S., harming downwind ecosystems. Nr deposition in the eastern U.S. is also seeing a smaller upward trend of less than 5%.
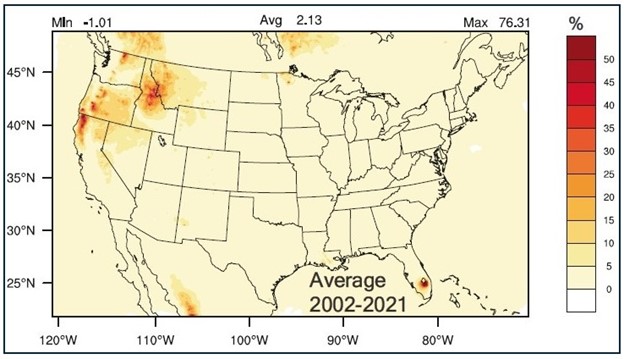
Figure 2: Relative change in average (2002–2021) total reactive nitrogen deposition [(FIRE minus NOFIRE)/NOFIRE).
Citation: Campbell, Patrick C., Daniel Q. Tong, Shinkuang Chang, Siqi Ma, Yunyao Li, Jiaxin Ding, Rick Saylor, Barry Baker, Youhua Tang, and John Walker, 2026: Increased contributions of climate-driven wildfires to nitrogen deposition in the United States. Commun. Earth Environ., 7, 254, https://doi.org/10.1038/s43247-026-03279-4.
« Back